Business Intelligence software: an objective comparison
Business Intelligence (BI) tools are software solutions designed to help users create, distribute, and analyze reports, dashboards, data analytics, and machine learning models. Their primary purpose is to extract meaningful insights from data quickly and efficiently. Since 2007, we have been conducting in-depth research and evaluations of the best and most widely used BI tools on the market, assessing them based on more than 250 criteria. On this page, we explore the key benefits of BI tools and provide an unbiased overview of leading software solutions. Additionally, we explain why Excel falls short as a BI tool and outline the five essential steps for selecting the right BI solution. Any questions about our research? Feel free to reach out for more information or schedule an appointment with us today.
The 7 benefits of Business Intelligence tools
BI tools allow you to quickly extract insights from large datasets, but their advantages go far beyond that. Here are seven key benefits of using BI tools:
- Gain a clear understanding of corporate and external data and enable big data analytics
- Ensure clear visualization and availability of management information
- Identify bottlenecks to improve workflow and processes
- Equip users with the tools they need to improve business processes
- Leverage data-driven insights to enhance overall business performance
- Get the perfect support for performance management and making strategic decisions
- Utilize intelligent dashboards for clear, real-time reporting and easy data tracking
Overview of BI tools for Data Analysis
 Click on any tool name to learn more, or refer to the Business Intelligence & Analytics Guide™ 2025 for an objective, in-depth comparison to help you choose the best BI solution for your organization. The list below is organized alphabetically for easy reference. At Passionned Group, we are 100% independent and have no affiliations with BI tool vendors, ensuring a completely unbiased evaluation.
1. Alteryx
![]() Alteryx is widely known for its products Alteryx Designer, Alteryx Server, Alteryx Analytics, Alteryx Connect, and Alteryx Intelligence Suite. The company is 100% specialized in BI & Analytics. Take a look at the images below. The Business Intelligence tools from Alteryx are strong in the following areas, among others:
Alteryx is widely known for its products Alteryx Designer, Alteryx Server, Alteryx Analytics, Alteryx Connect, and Alteryx Intelligence Suite. The company is 100% specialized in BI & Analytics. Take a look at the images below. The Business Intelligence tools from Alteryx are strong in the following areas, among others:
- analytics
- machine learning
- data science
- Python
- text mining
- authentication
- advanced analytics
- Windows
- analysis
- computer vision
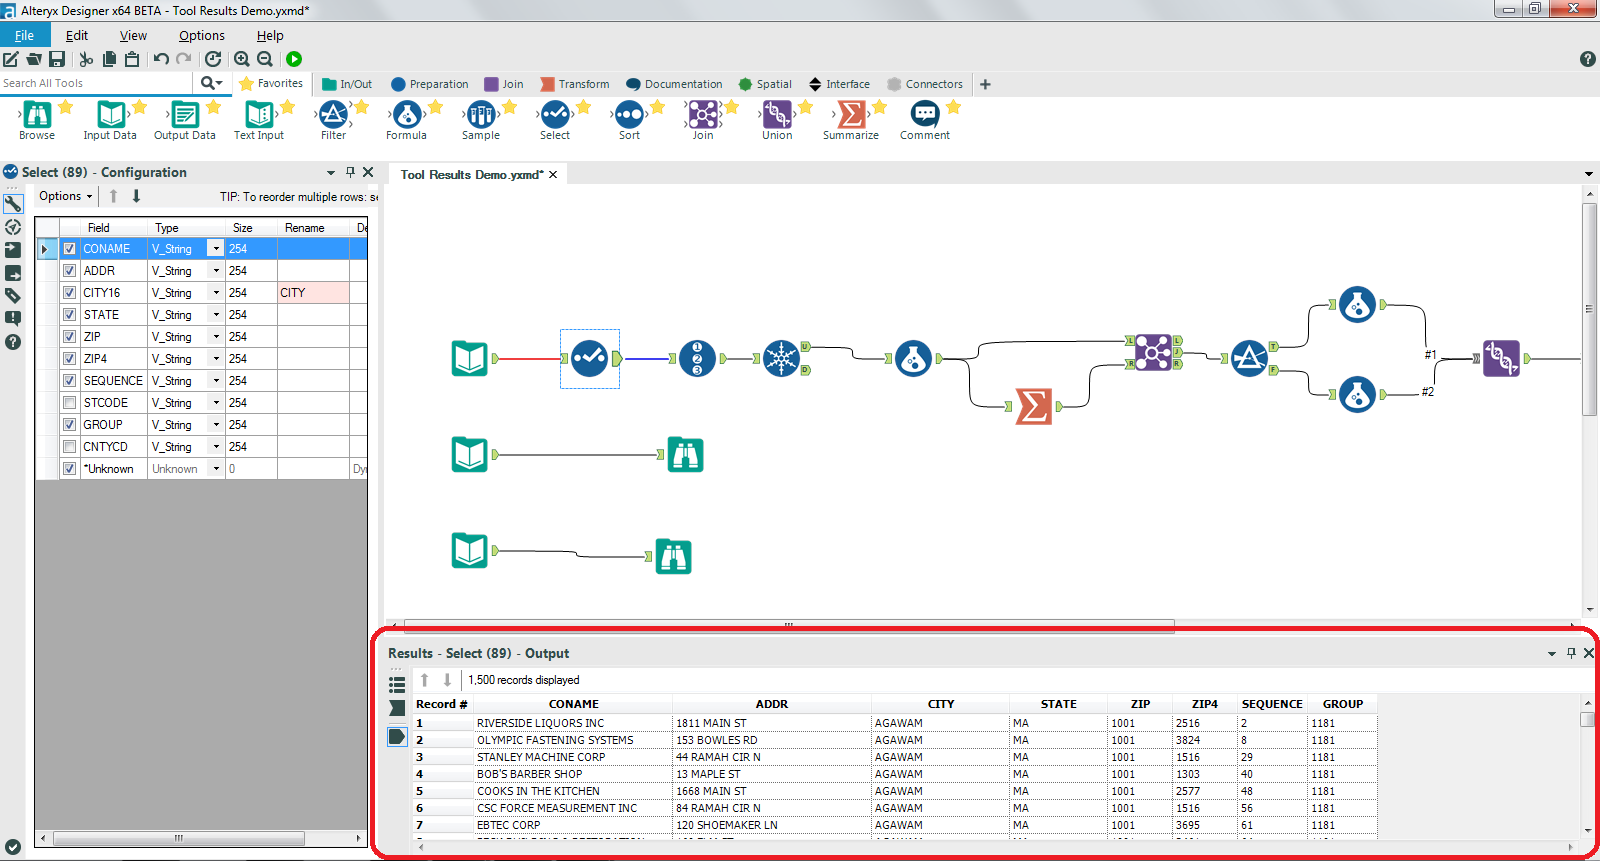 Figure 1: Alteryx Designer
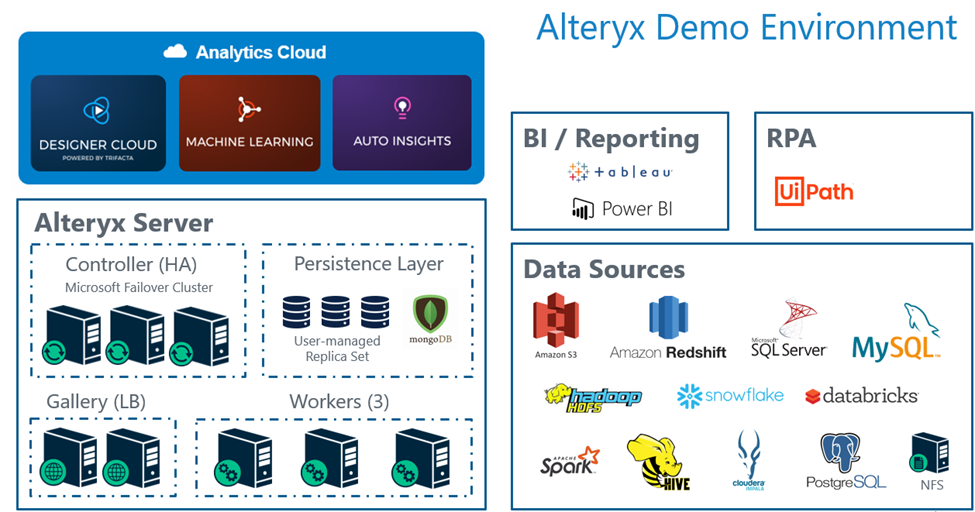 Figure 2: Alteryx Server
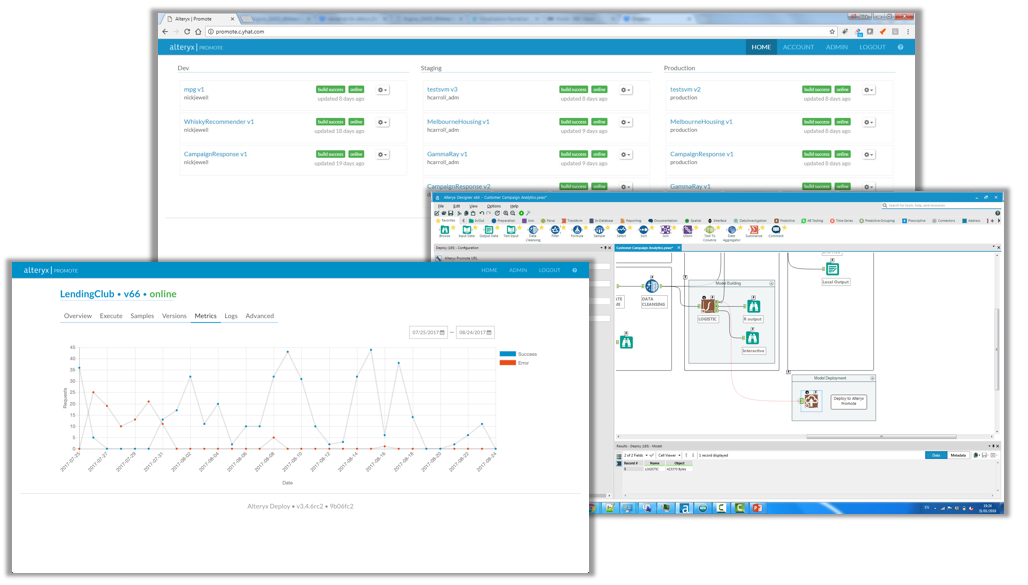 Figure 3: Alteryx Analytics
2. DataRobot
![]() DataRobot is widely known for its products DataRobot Artificial Intelligence, DataRobot MLOps, DataRobot Core, DataRobot platform, and DataRobot AutoML. The company is 100% specialized in BI & Analytics. Take a look at the images below. The Business Intelligence tools from DataRobot are strong in the following areas, among others:
DataRobot is widely known for its products DataRobot Artificial Intelligence, DataRobot MLOps, DataRobot Core, DataRobot platform, and DataRobot AutoML. The company is 100% specialized in BI & Analytics. Take a look at the images below. The Business Intelligence tools from DataRobot are strong in the following areas, among others:
- artificial intelligence
- generative AI
- data science
- automated machine learning
- Python
- machine learning models
- reporting
- analytics
- time series
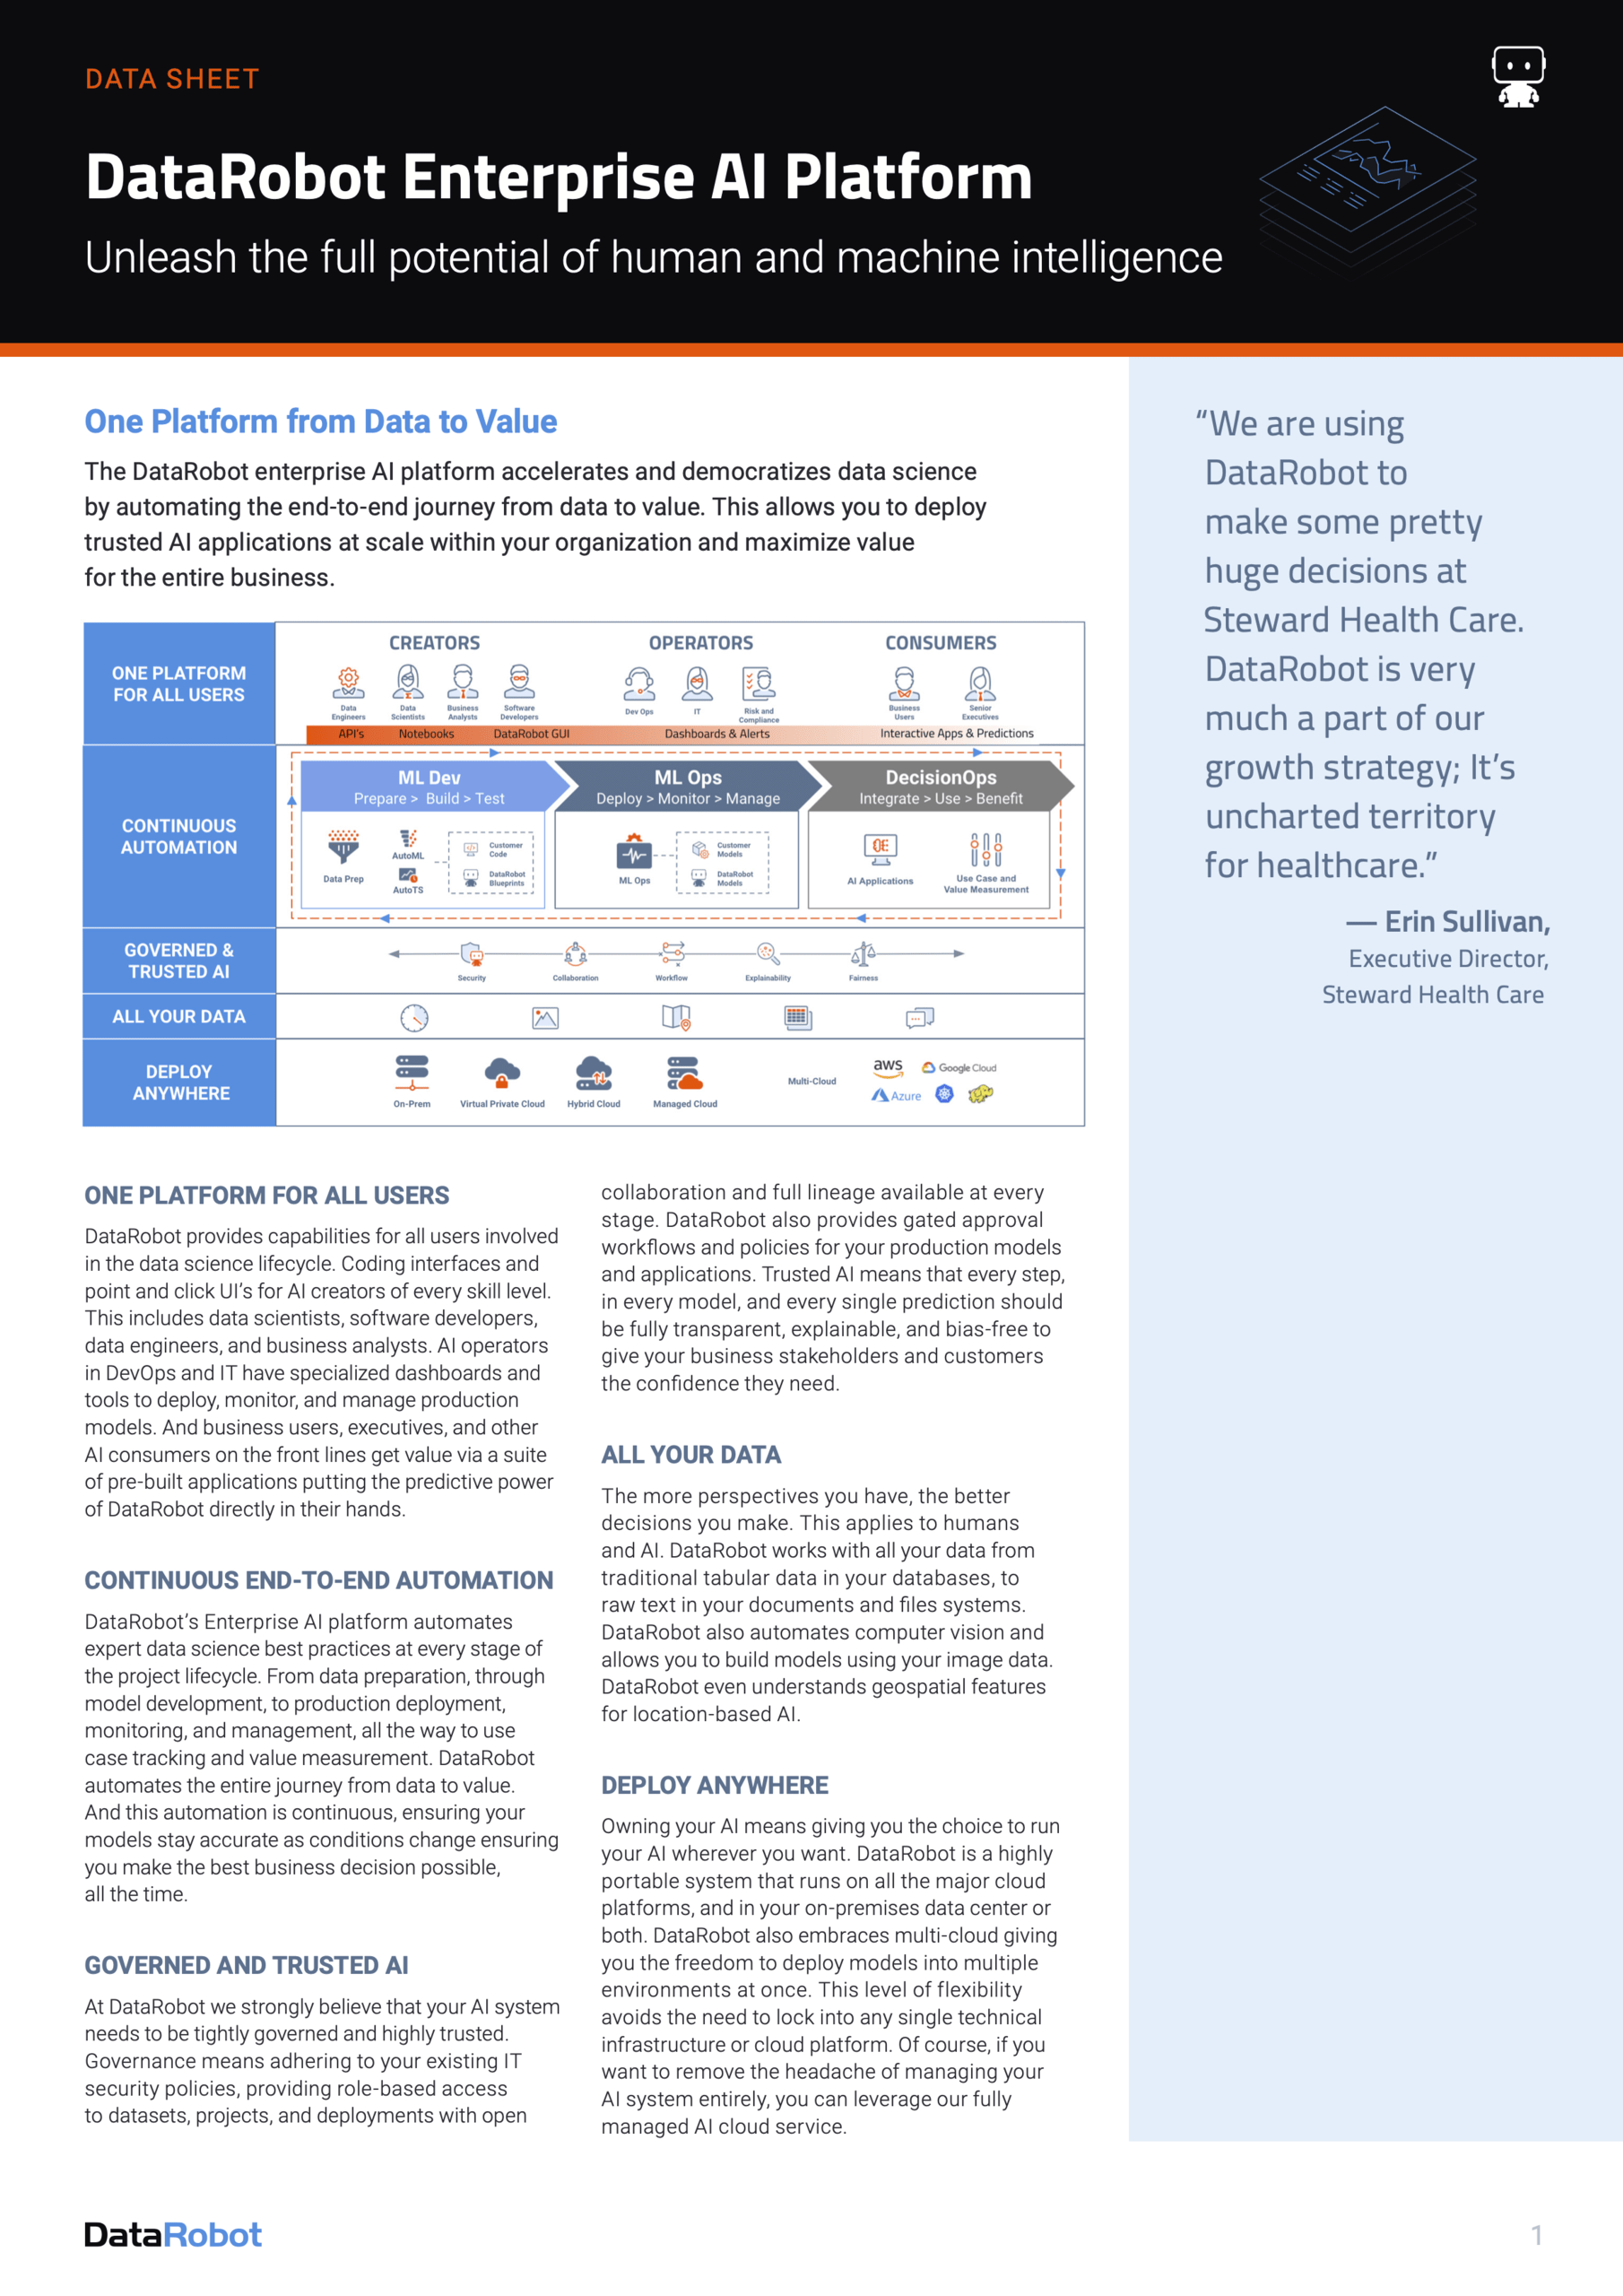 Figure 4: DataRobot Artificial Intelligence
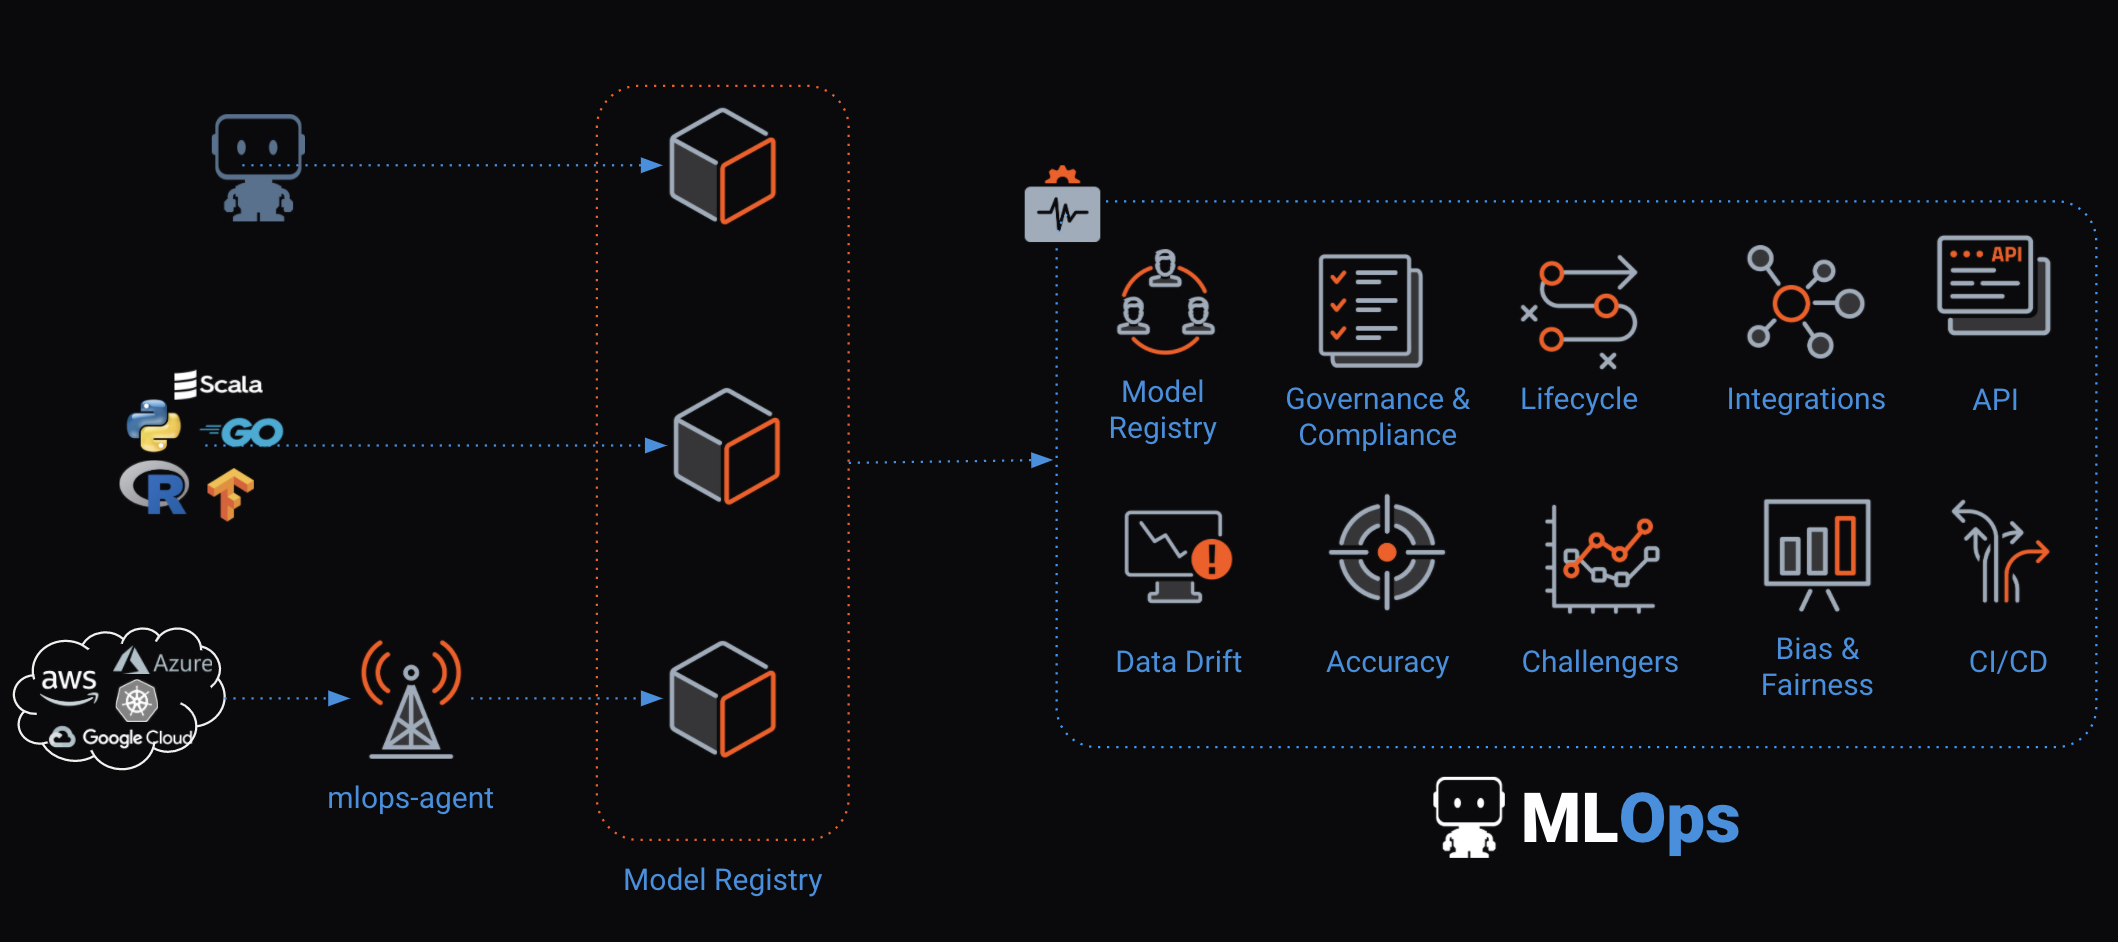 Figure 5: DataRobot MLOps
 Figure 6: DataRobot Core
3. Domo
 The most well-known products in the area of BI & Analytics of the company Domo are Domo Platform, Domo Data Science, Domo Business Intelligence, Domo Data Visualization, and Domo Mobile. We analyzed and evaluated these BI & Analytics products in depth and meticulously. The Business Intelligence tools from Domo can be characterized by good support on the following topics:
- data science
- data visualization
- business intelligence
- analytics
- machine learning
- analysis
- real-time data
- dashboards
- tiles
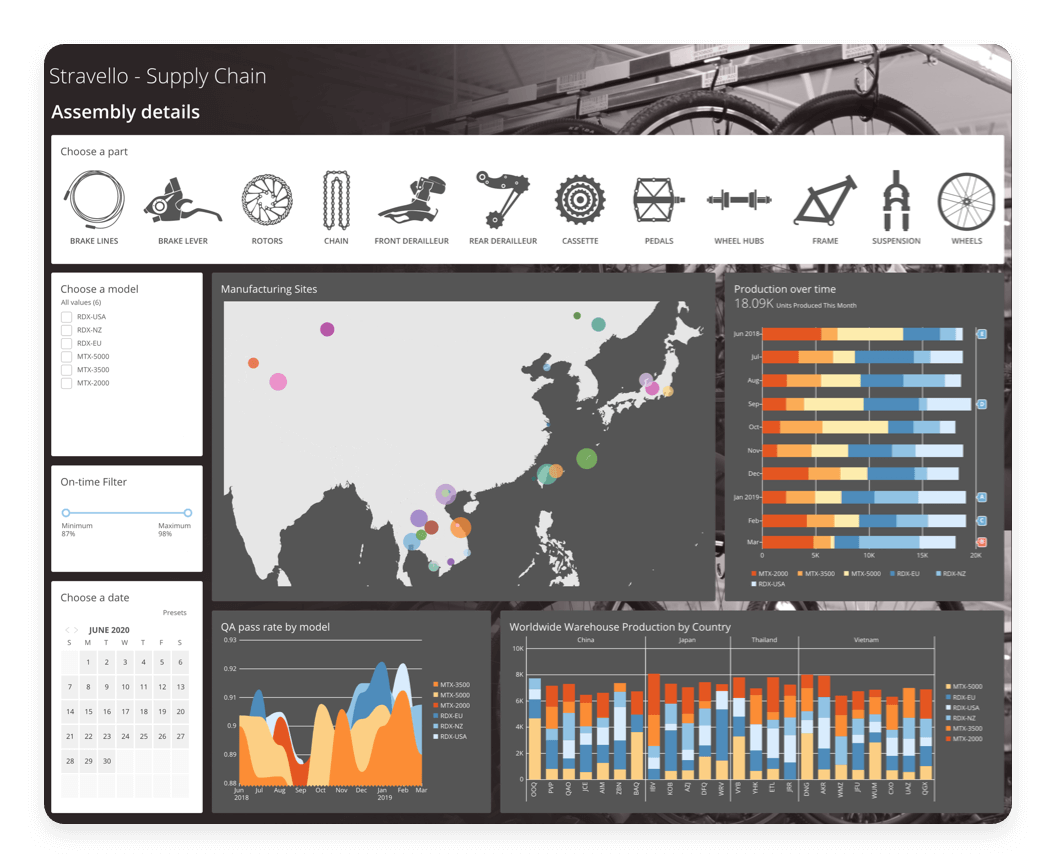 Figure 7: Domo Platform
 Figure 8: Domo Data Science
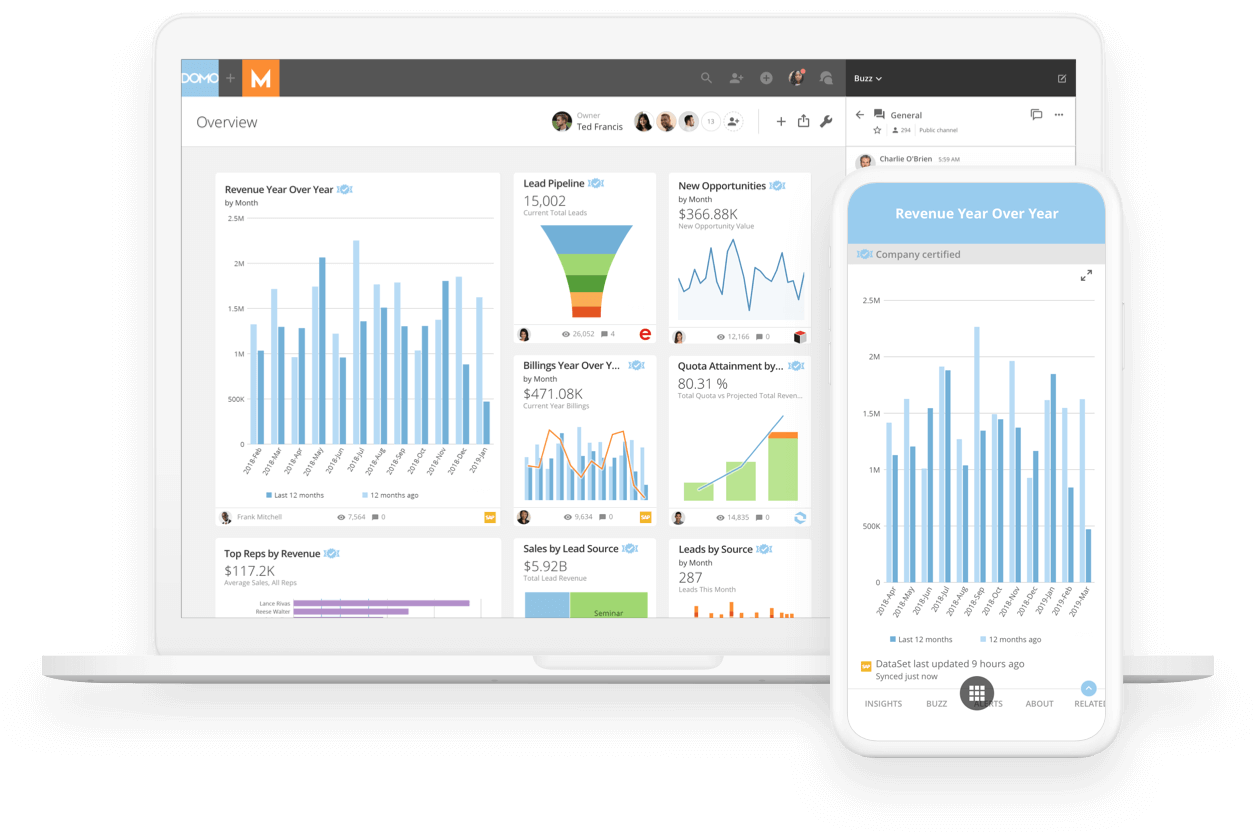 Figure 9: Domo Business Intelligence
4. Dundas
![]() The most well-known products in the area of BI & Analytics of the company Dundas are Dundas Data Visualization, Dundas Dashboard, and Dundas BI Data Flow. We analyzed and evaluated these BI & Analytics products in depth and meticulously. The Business Intelligence tools from Dundas can be characterized by good support on the following topics:
The most well-known products in the area of BI & Analytics of the company Dundas are Dundas Data Visualization, Dundas Dashboard, and Dundas BI Data Flow. We analyzed and evaluated these BI & Analytics products in depth and meticulously. The Business Intelligence tools from Dundas can be characterized by good support on the following topics:
- data visualization
- dashboards
- business intelligence
- reporting
- analytics platform
- analysis
- real-time
- data discovery
- interactive dashboards
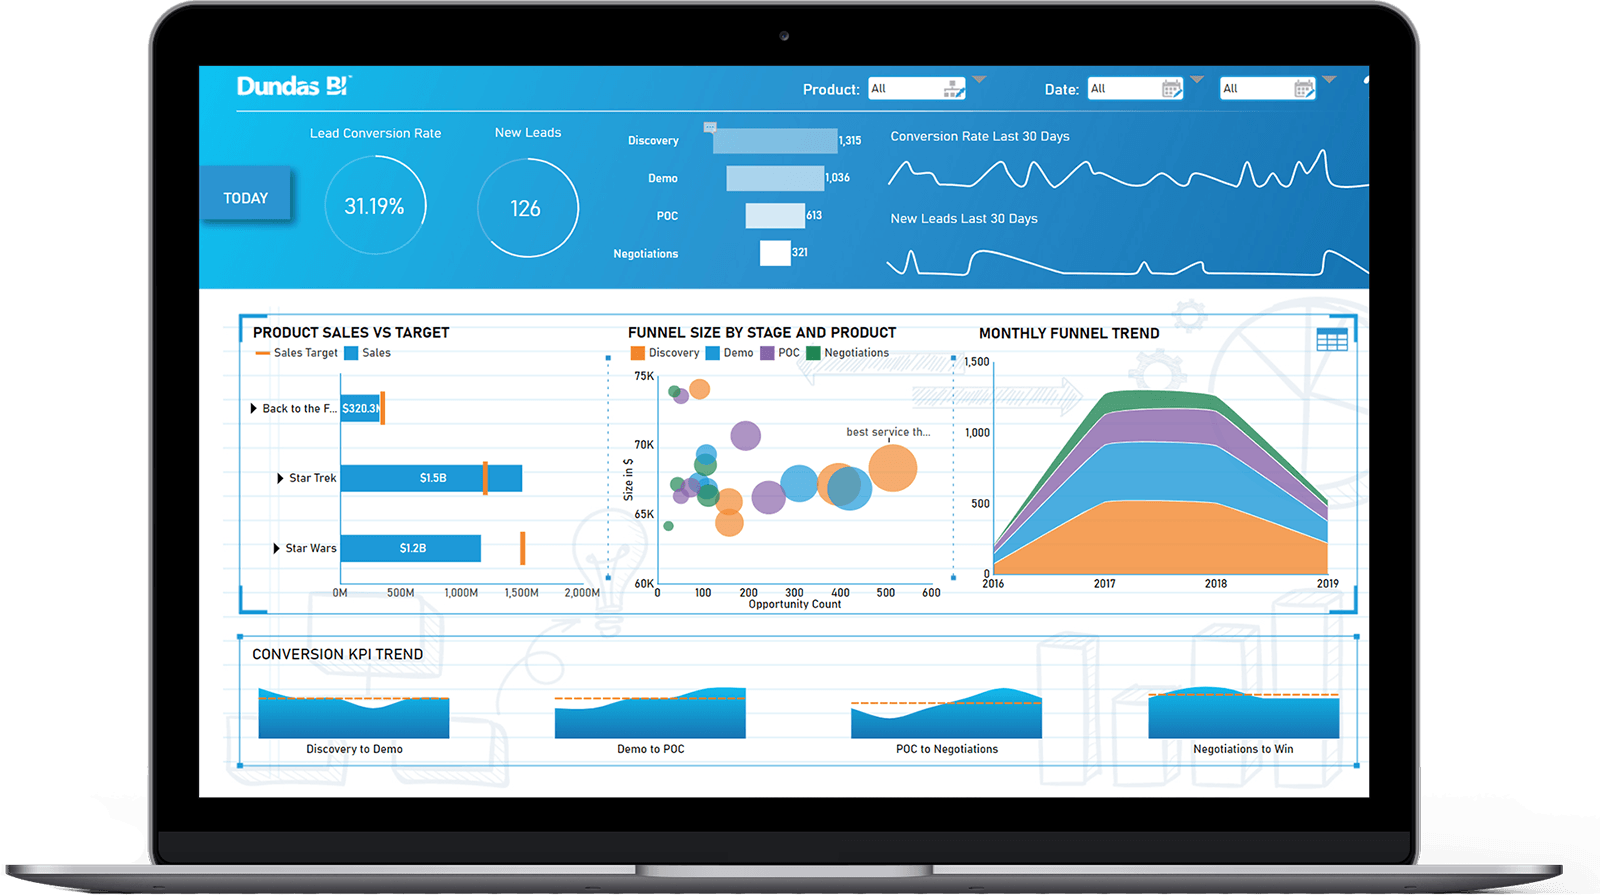 Figure 10: Dundas BI
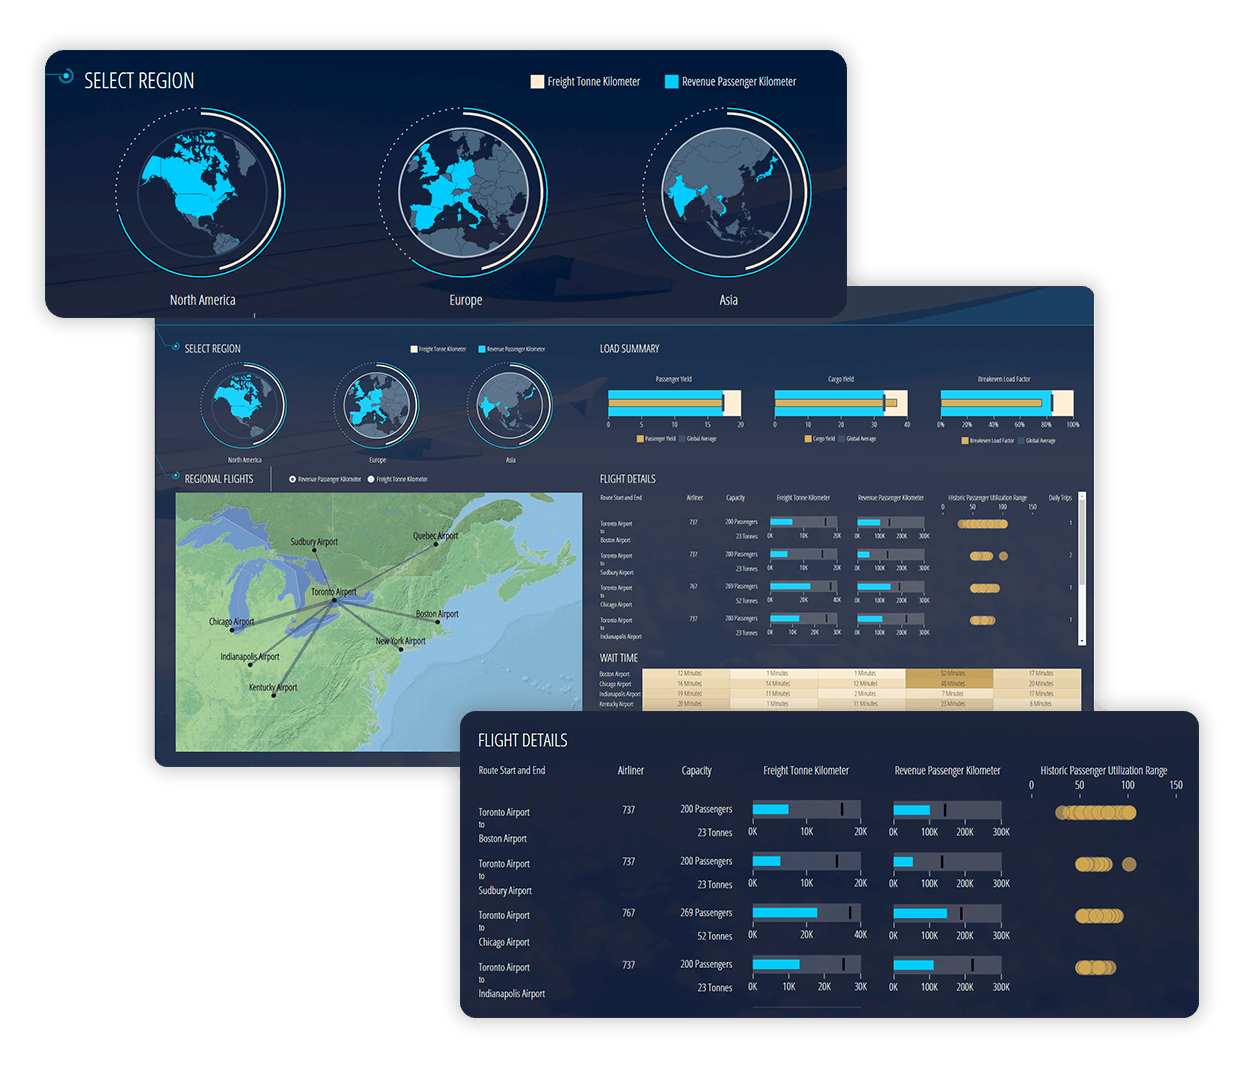 Figure 11: Dundas Data Visualization
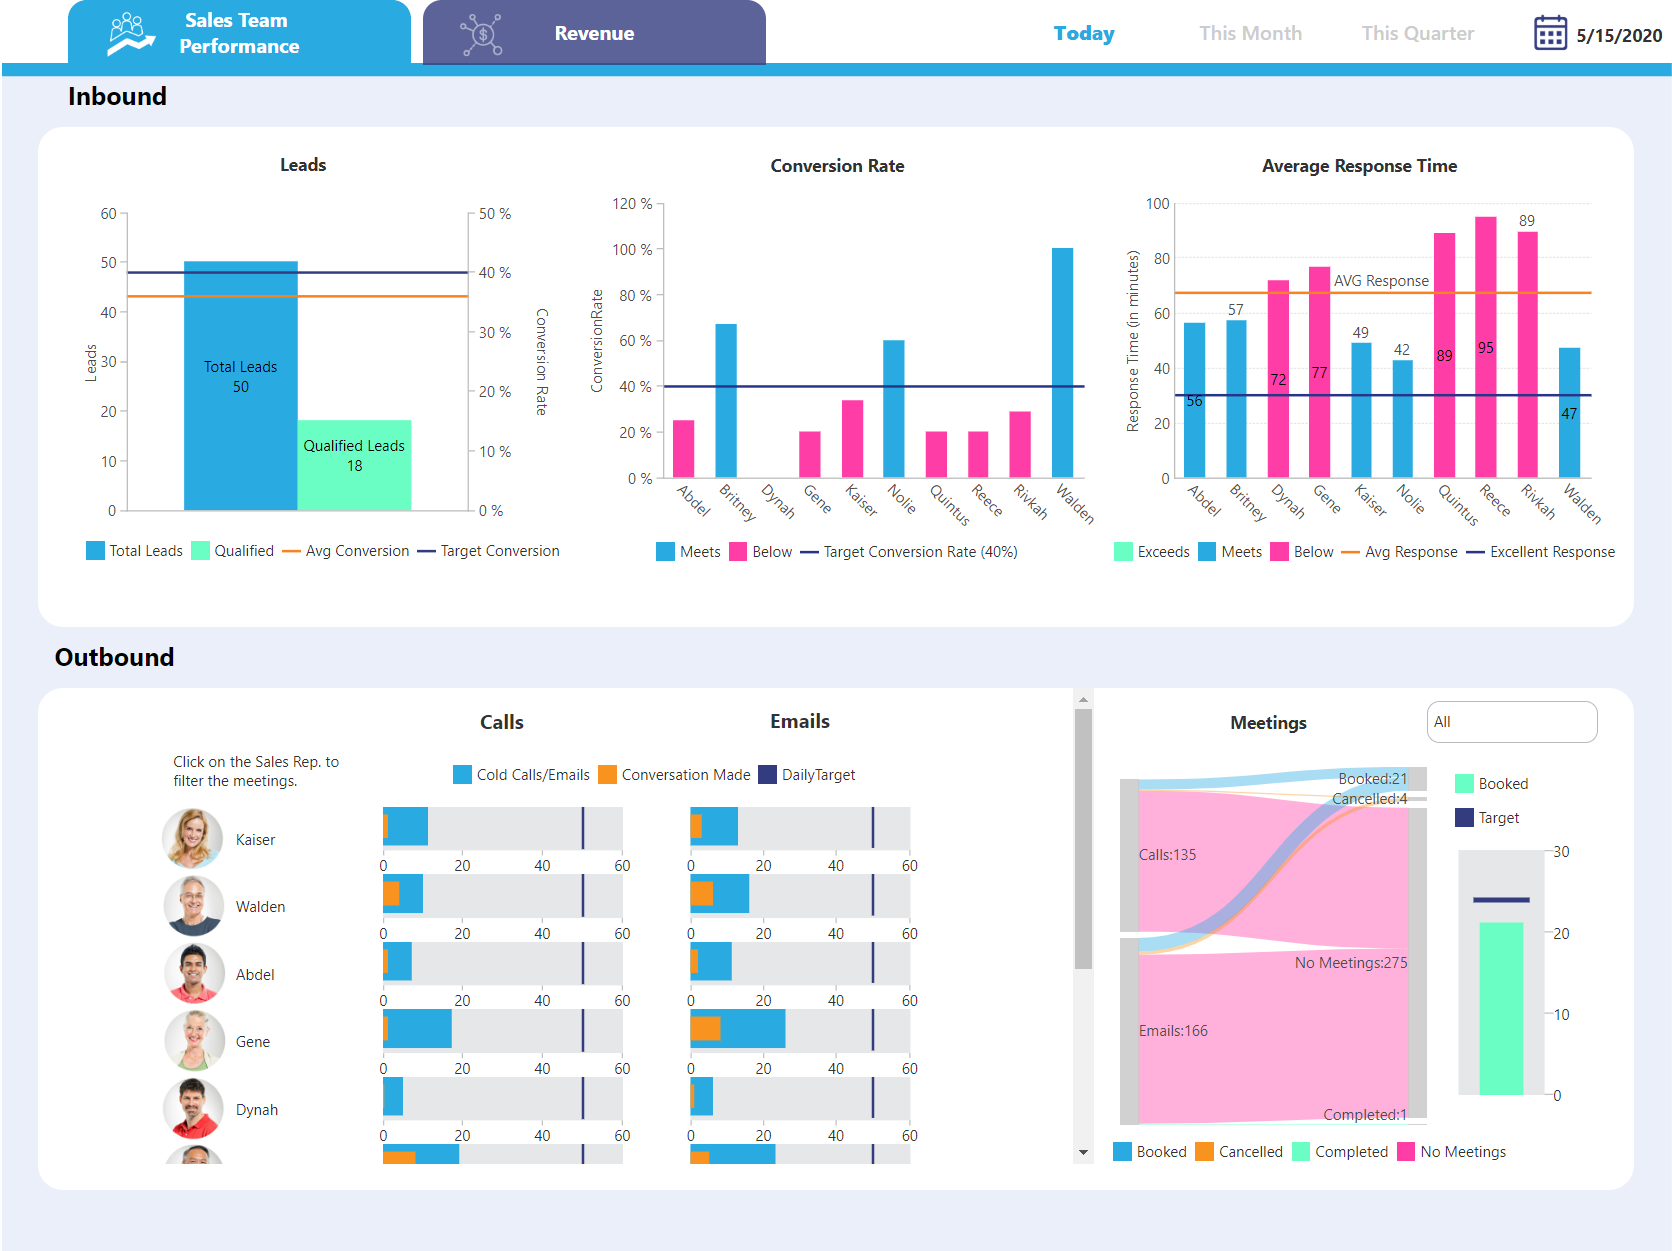 Figure 12: Dundas Dashboard
5. GoodData
 As far as we have been able to ascertain, GoodData currently has only one primary product: GoodData Platform. Take a look at the screen shots below. The Business Intelligence tools from GoodData are strong in the following areas, among others:
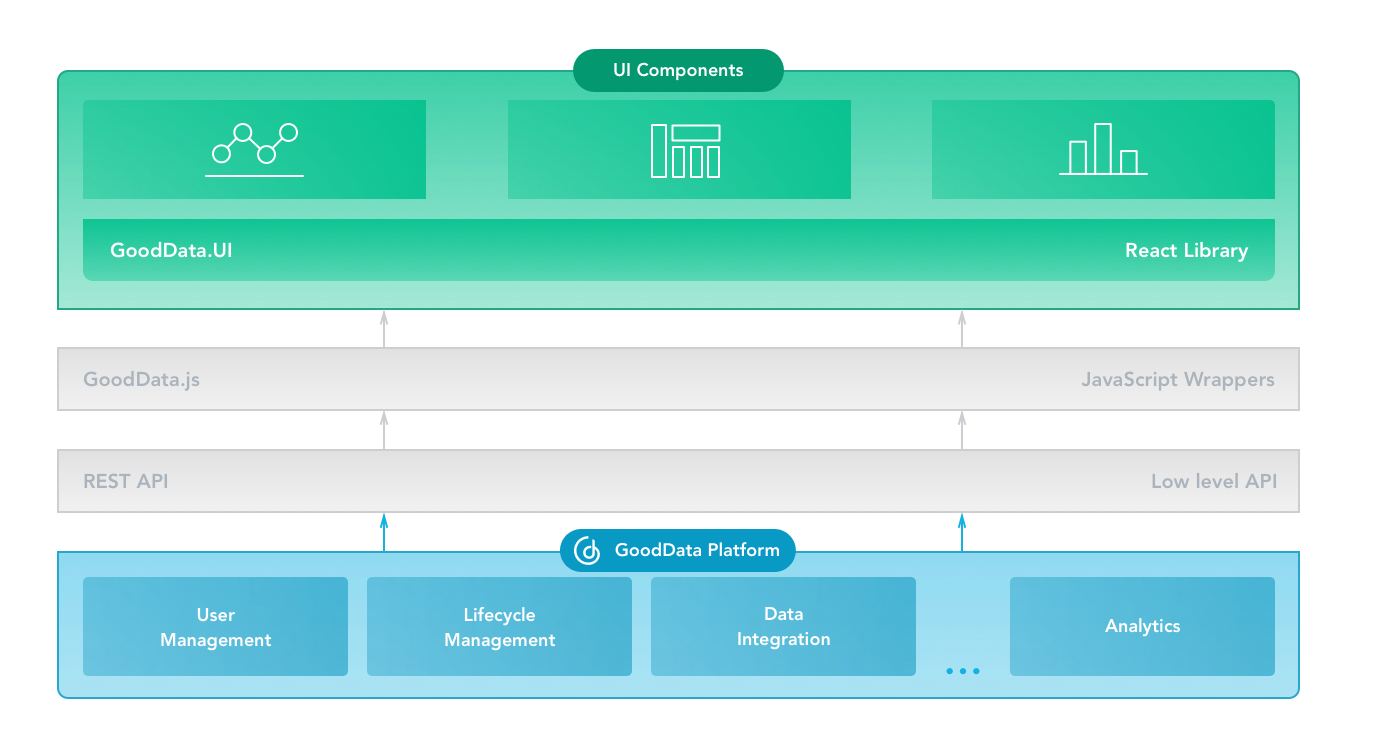 Figure 13: GoodData Platform
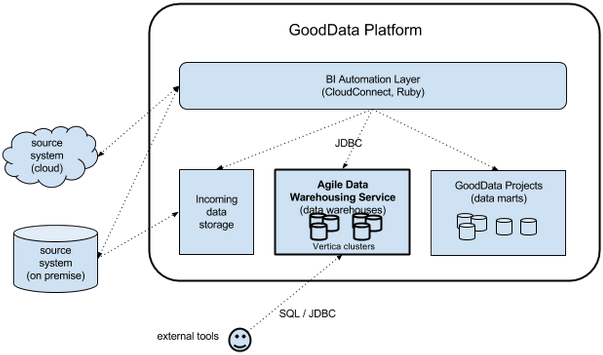 Figure 14: GoodData Platform
 Figure 15: GoodData Platform
6. IBM BI & Analytics
![]() IBM is widely known for its products Cognos Analytics, IBM SPSS, IBM Watson, IBM Infosphere, and Netezza. Take a look at the images below. The Business Intelligence tools from IBM are strong in the following areas, among others:
IBM is widely known for its products Cognos Analytics, IBM SPSS, IBM Watson, IBM Infosphere, and Netezza. Take a look at the images below. The Business Intelligence tools from IBM are strong in the following areas, among others:
- analytics
- analysis
- real-time
- cube
- business intelligence
- IBM Netezza
- text analytics
- OLAP
- natural language processing
 Figure 16: Cognos Analytics
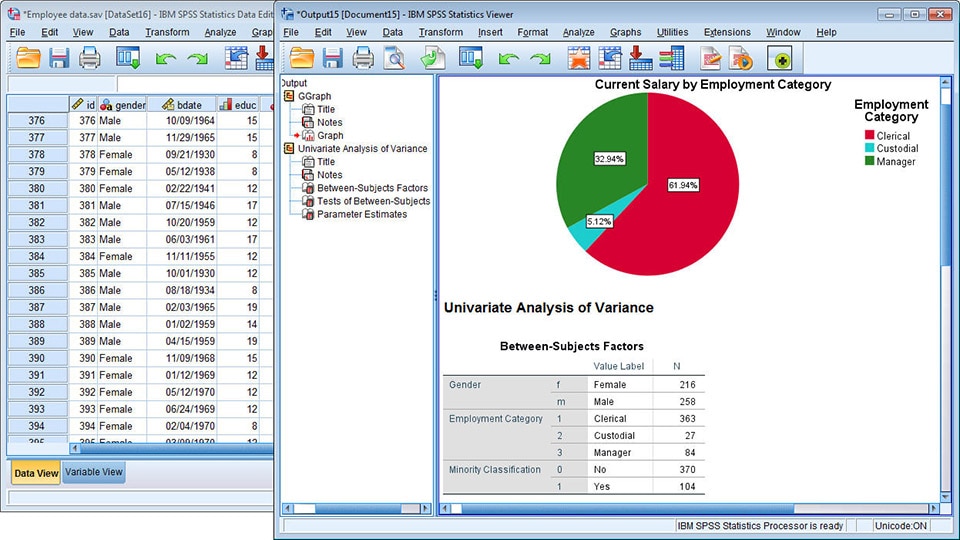 Figure 17: IBM SPSS
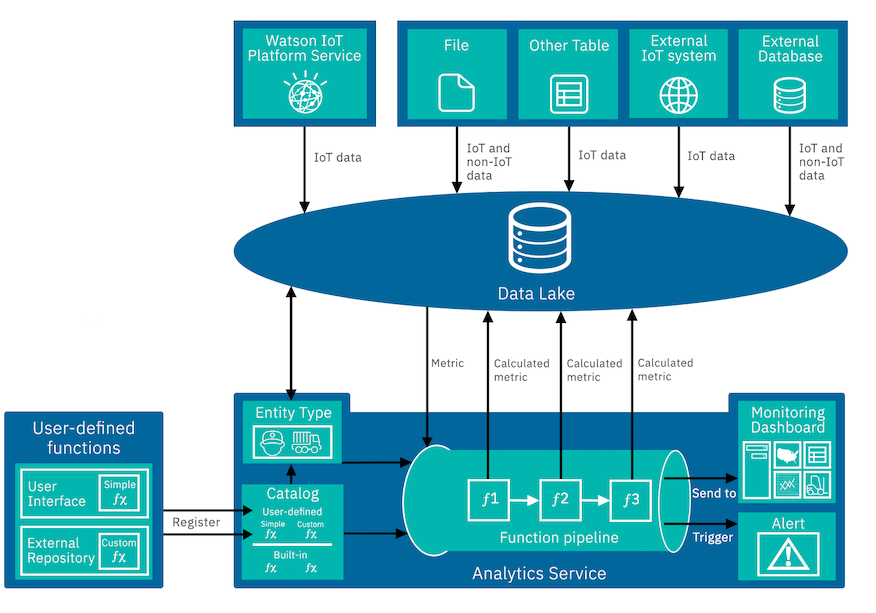 Figure 18: IBM Watson
7. Incorta
 The most well-known products in the area of BI & Analytics of the company Incorta are Incorta Analytics, and Incorta analyzer. We analyzed and evaluated these BI & Analytics products in depth and meticulously. The Business Intelligence tools from Incorta can be characterized by good support on the following topics:
- analytics platform
- reporting
- dashboards
- analysis
- real-time
- business intelligence
- data science
- data hub
- data management
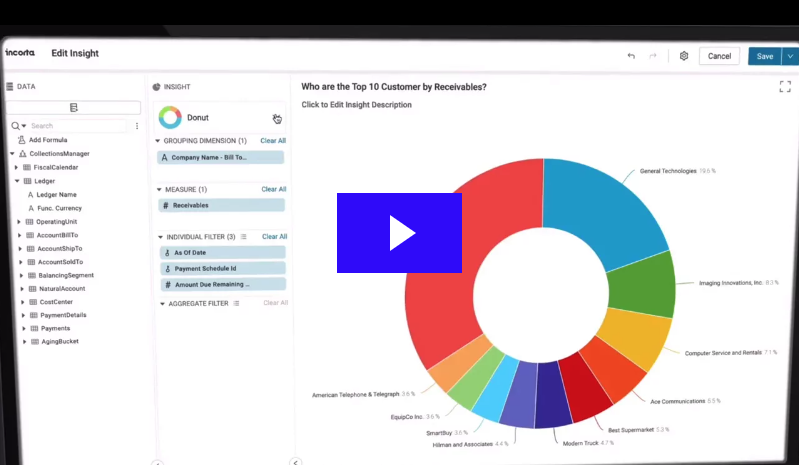 Figure 19: Incorta Analytics
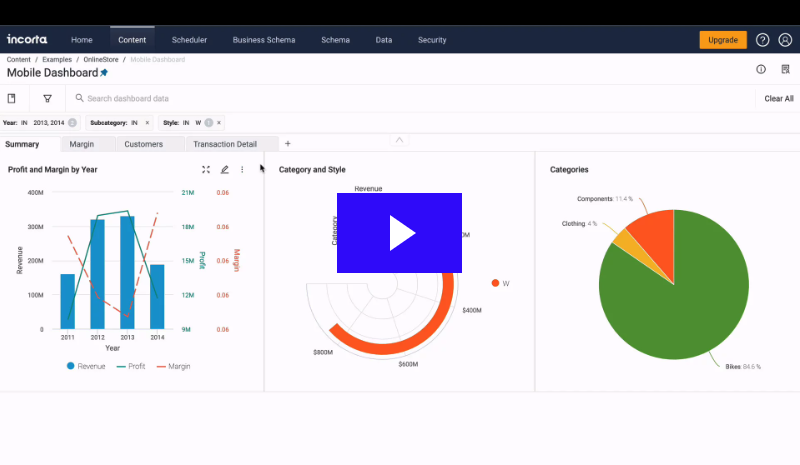 Figure 20: Incorta Analytics
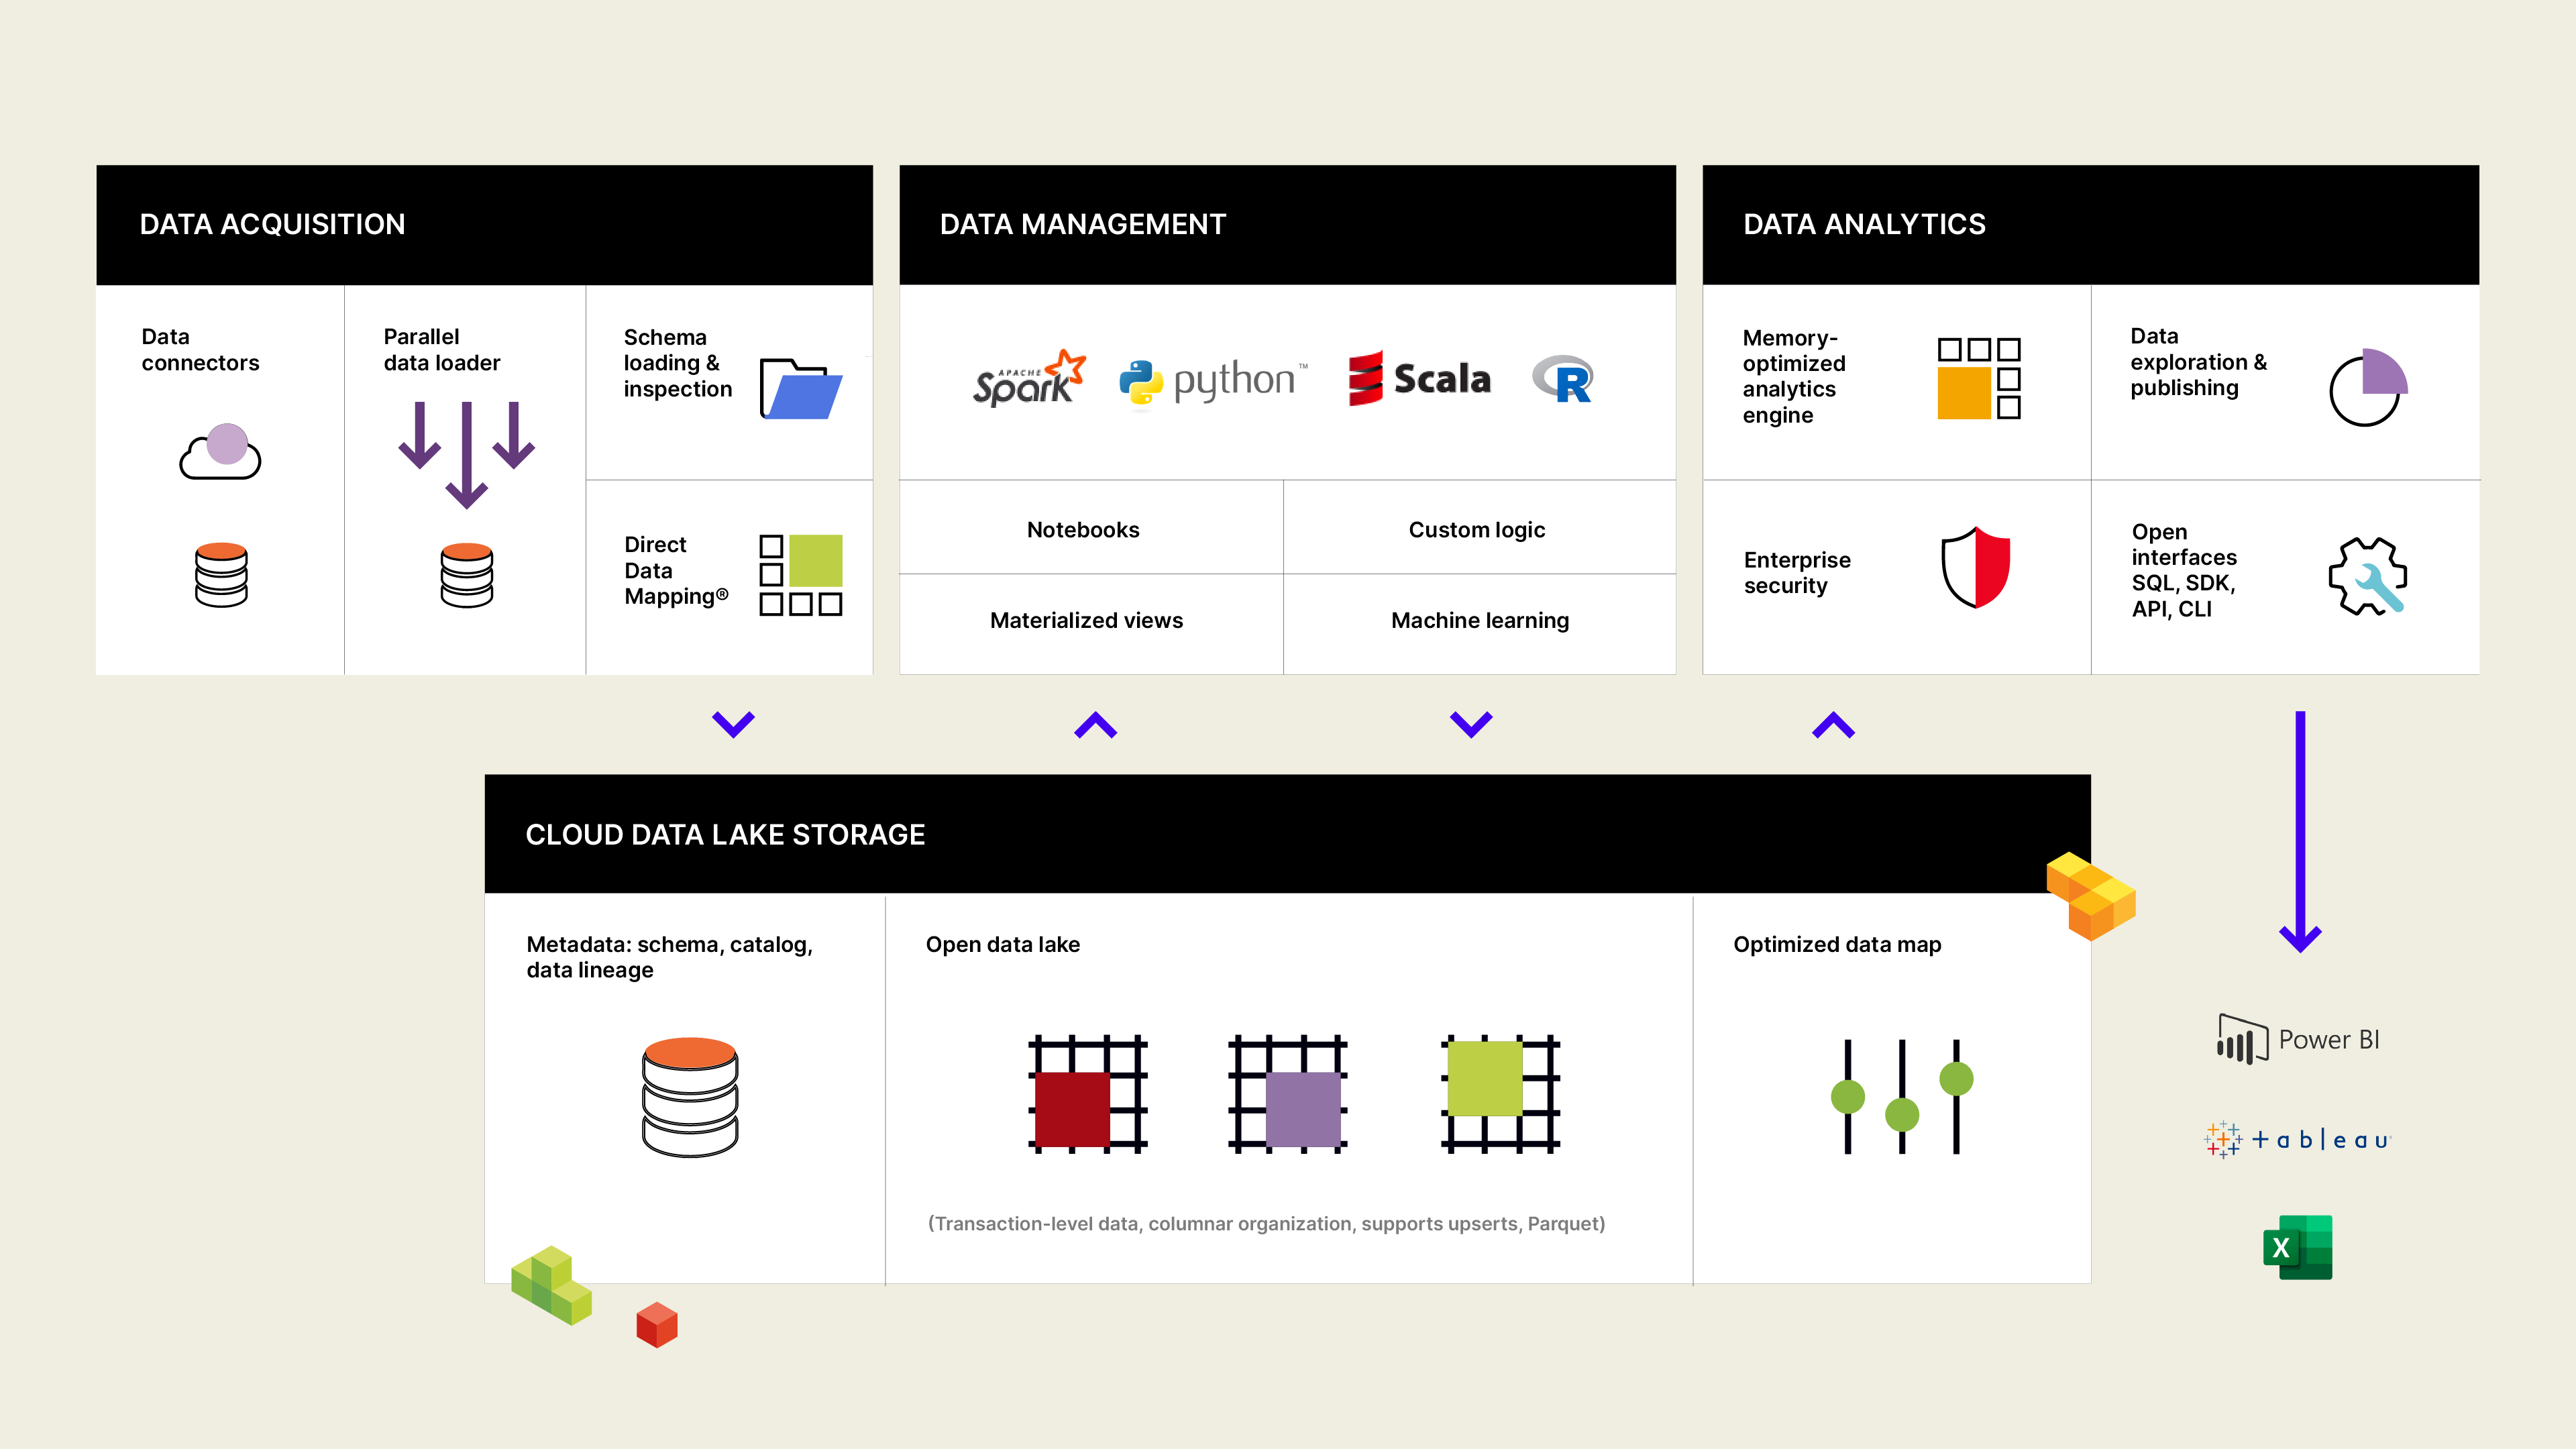 Figure 21: Incorta Analytics
8. InetSoft
![]() InetSoft is widely known for its products InetSoft Style Intelligence, InetSoft Business Intelligence, InetSoft Data Intelligence, InetSoft Style Studio, and InetSoft Data Cleansing. The company is 100% specialized in BI & Analytics. Take a look at the images below. The Business Intelligence tools from InetSoft are strong in the following areas, among others:
InetSoft is widely known for its products InetSoft Style Intelligence, InetSoft Business Intelligence, InetSoft Data Intelligence, InetSoft Style Studio, and InetSoft Data Cleansing. The company is 100% specialized in BI & Analytics. Take a look at the images below. The Business Intelligence tools from InetSoft are strong in the following areas, among others:
- business intelligence
- analytics
- reporting
- dashboards
- analysis
- big data
- data discovery
- data visualization
- data modeling
- cloud computing
 Figure 22: InetSoft Style Intelligence
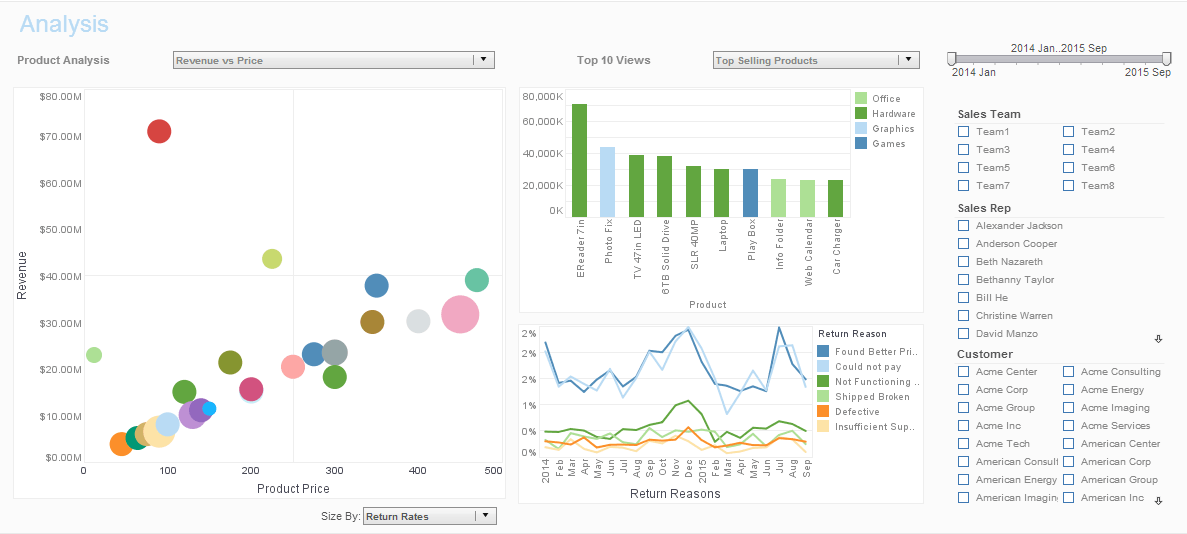 Figure 23: InetSoft Business Intelligence
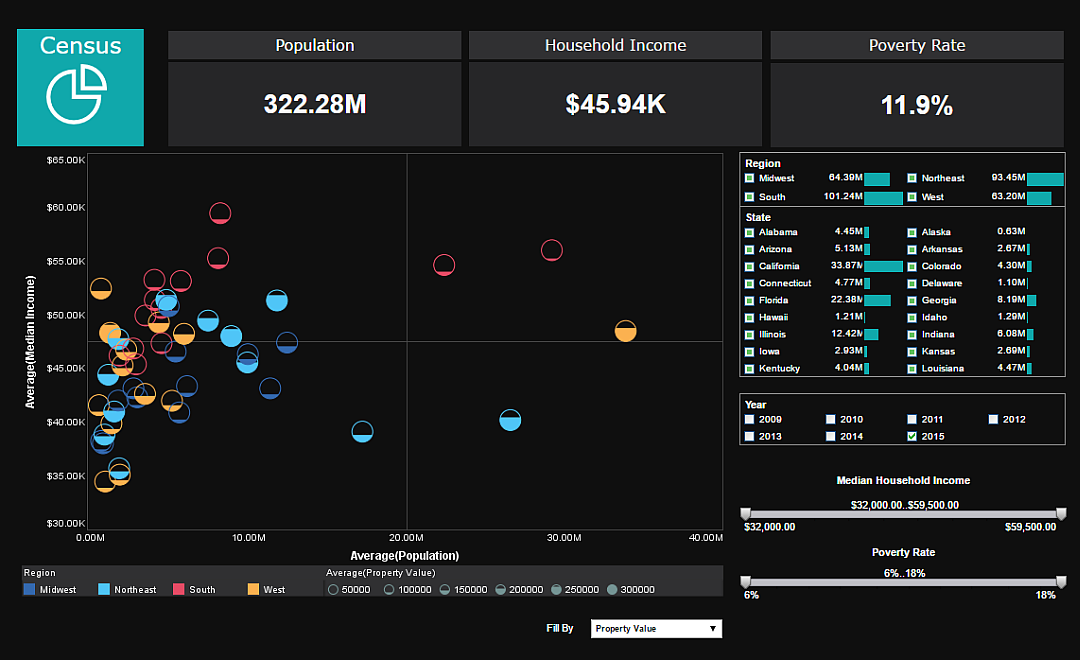 Figure 24: InetSoft Data Intelligence
9. Infor BI & Analytics
![]() Infor is widely known for its products Infor Birst, Infor BI, Infor Landmark, and Infor Coleman AI. Take a look at the images below. The Business Intelligence tools from Infor are strong in the following areas, among others:
Infor is widely known for its products Infor Birst, Infor BI, Infor Landmark, and Infor Coleman AI. Take a look at the images below. The Business Intelligence tools from Infor are strong in the following areas, among others:
- reporting
- IoT
- dashboards
- business intelligence
- machine learning
- artificial intelligence
- analysis
- analytics platform
- Microsoft Teams
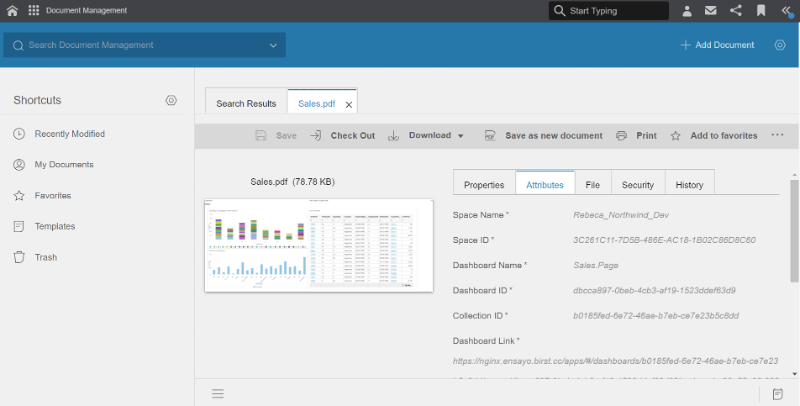 Figure 25: Infor Birst
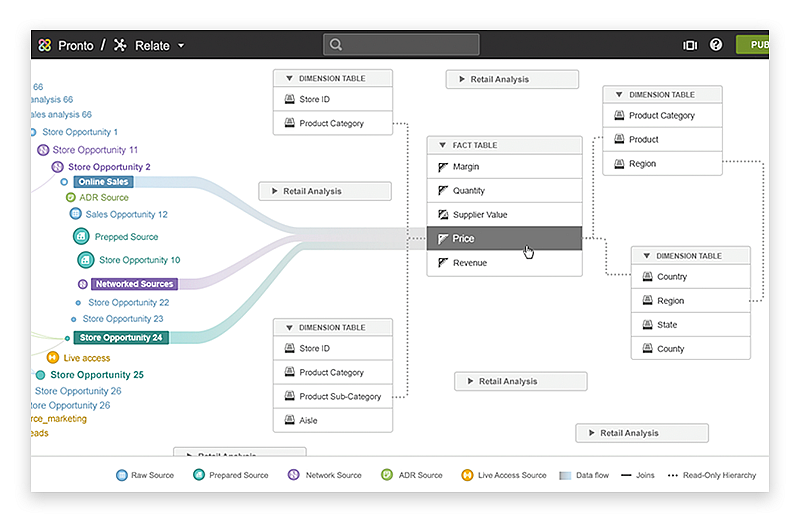 Figure 26: Infor BI
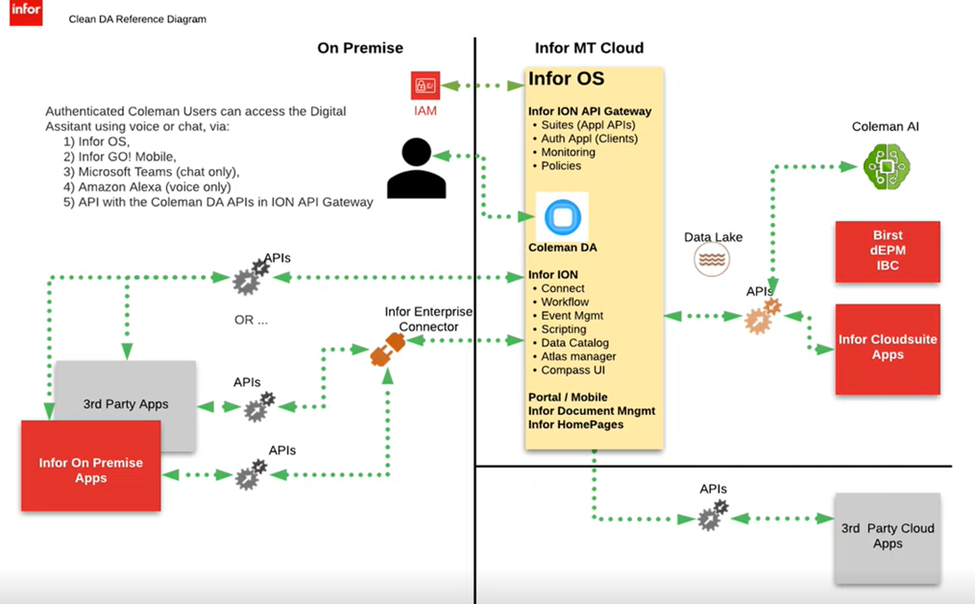 Figure 27: Infor Coleman
10. insightssoftware BI & Analytics
![]() The most well-known products in the area of BI & Analytics of the company insightssoftware are Logi Info, Logi Composer, Logi Report Server, Logi Predict, and Logi Report Designer. We analyzed and evaluated these BI & Analytics products in depth and meticulously. The Business Intelligence tools from insightssoftware can be characterized by good support on the following topics:
The most well-known products in the area of BI & Analytics of the company insightssoftware are Logi Info, Logi Composer, Logi Report Server, Logi Predict, and Logi Report Designer. We analyzed and evaluated these BI & Analytics products in depth and meticulously. The Business Intelligence tools from insightssoftware can be characterized by good support on the following topics:
- analytics platform
- embedded analytics
- reporting
- dashboards
- java
- performance management
- business intelligence
- interactive dashboards
- Windows
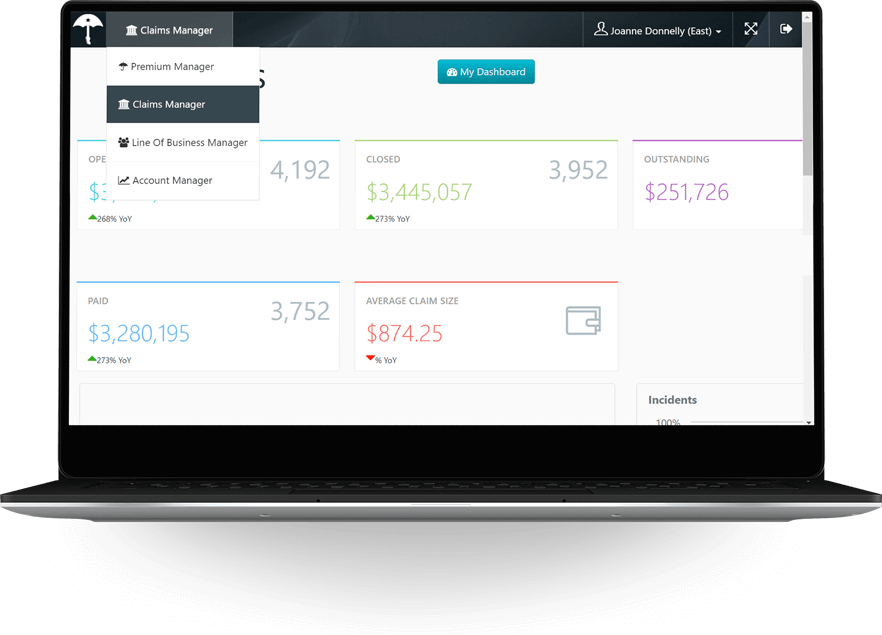 Figure 28: Logi Info
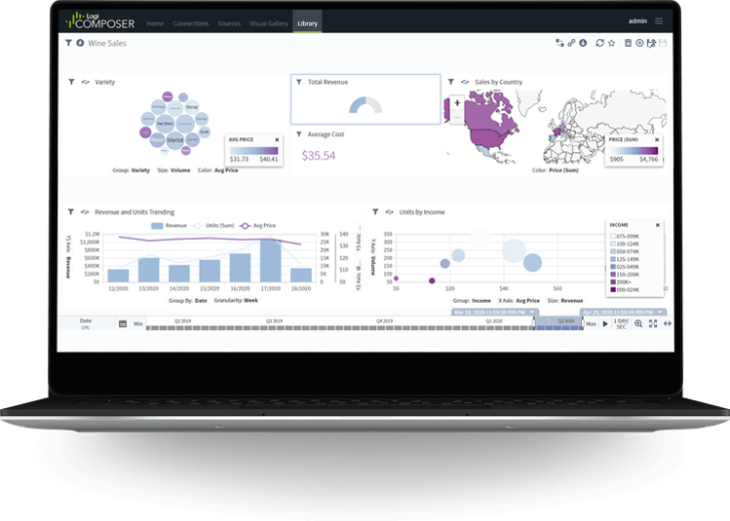 Figure 29: Logi Composer
 Figure 30: Logi Report Server
11. Looker
![]() Looker is widely known for its products Looker Studio, Looker API, LookML Dashboards, and Looker Blocks. The company is 100% specialized in BI & Analytics. Take a look at the images below. The Business Intelligence tools from Looker are strong in the following areas, among others:
Looker is widely known for its products Looker Studio, Looker API, LookML Dashboards, and Looker Blocks. The company is 100% specialized in BI & Analytics. Take a look at the images below. The Business Intelligence tools from Looker are strong in the following areas, among others:
- dashboards
- SQL
- embedded analytics
- business intelligence
- analysis
- Google Analytics
- analytics platform
- web analytics
- marketing analytics
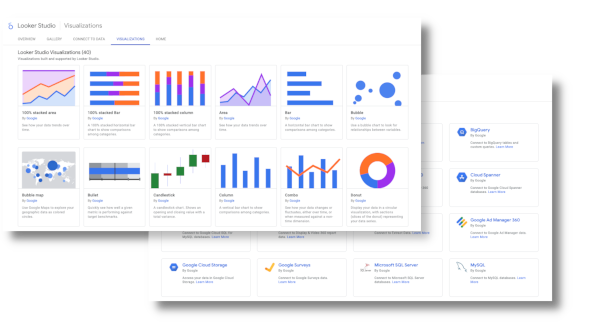 Figure 31: Looker Studio
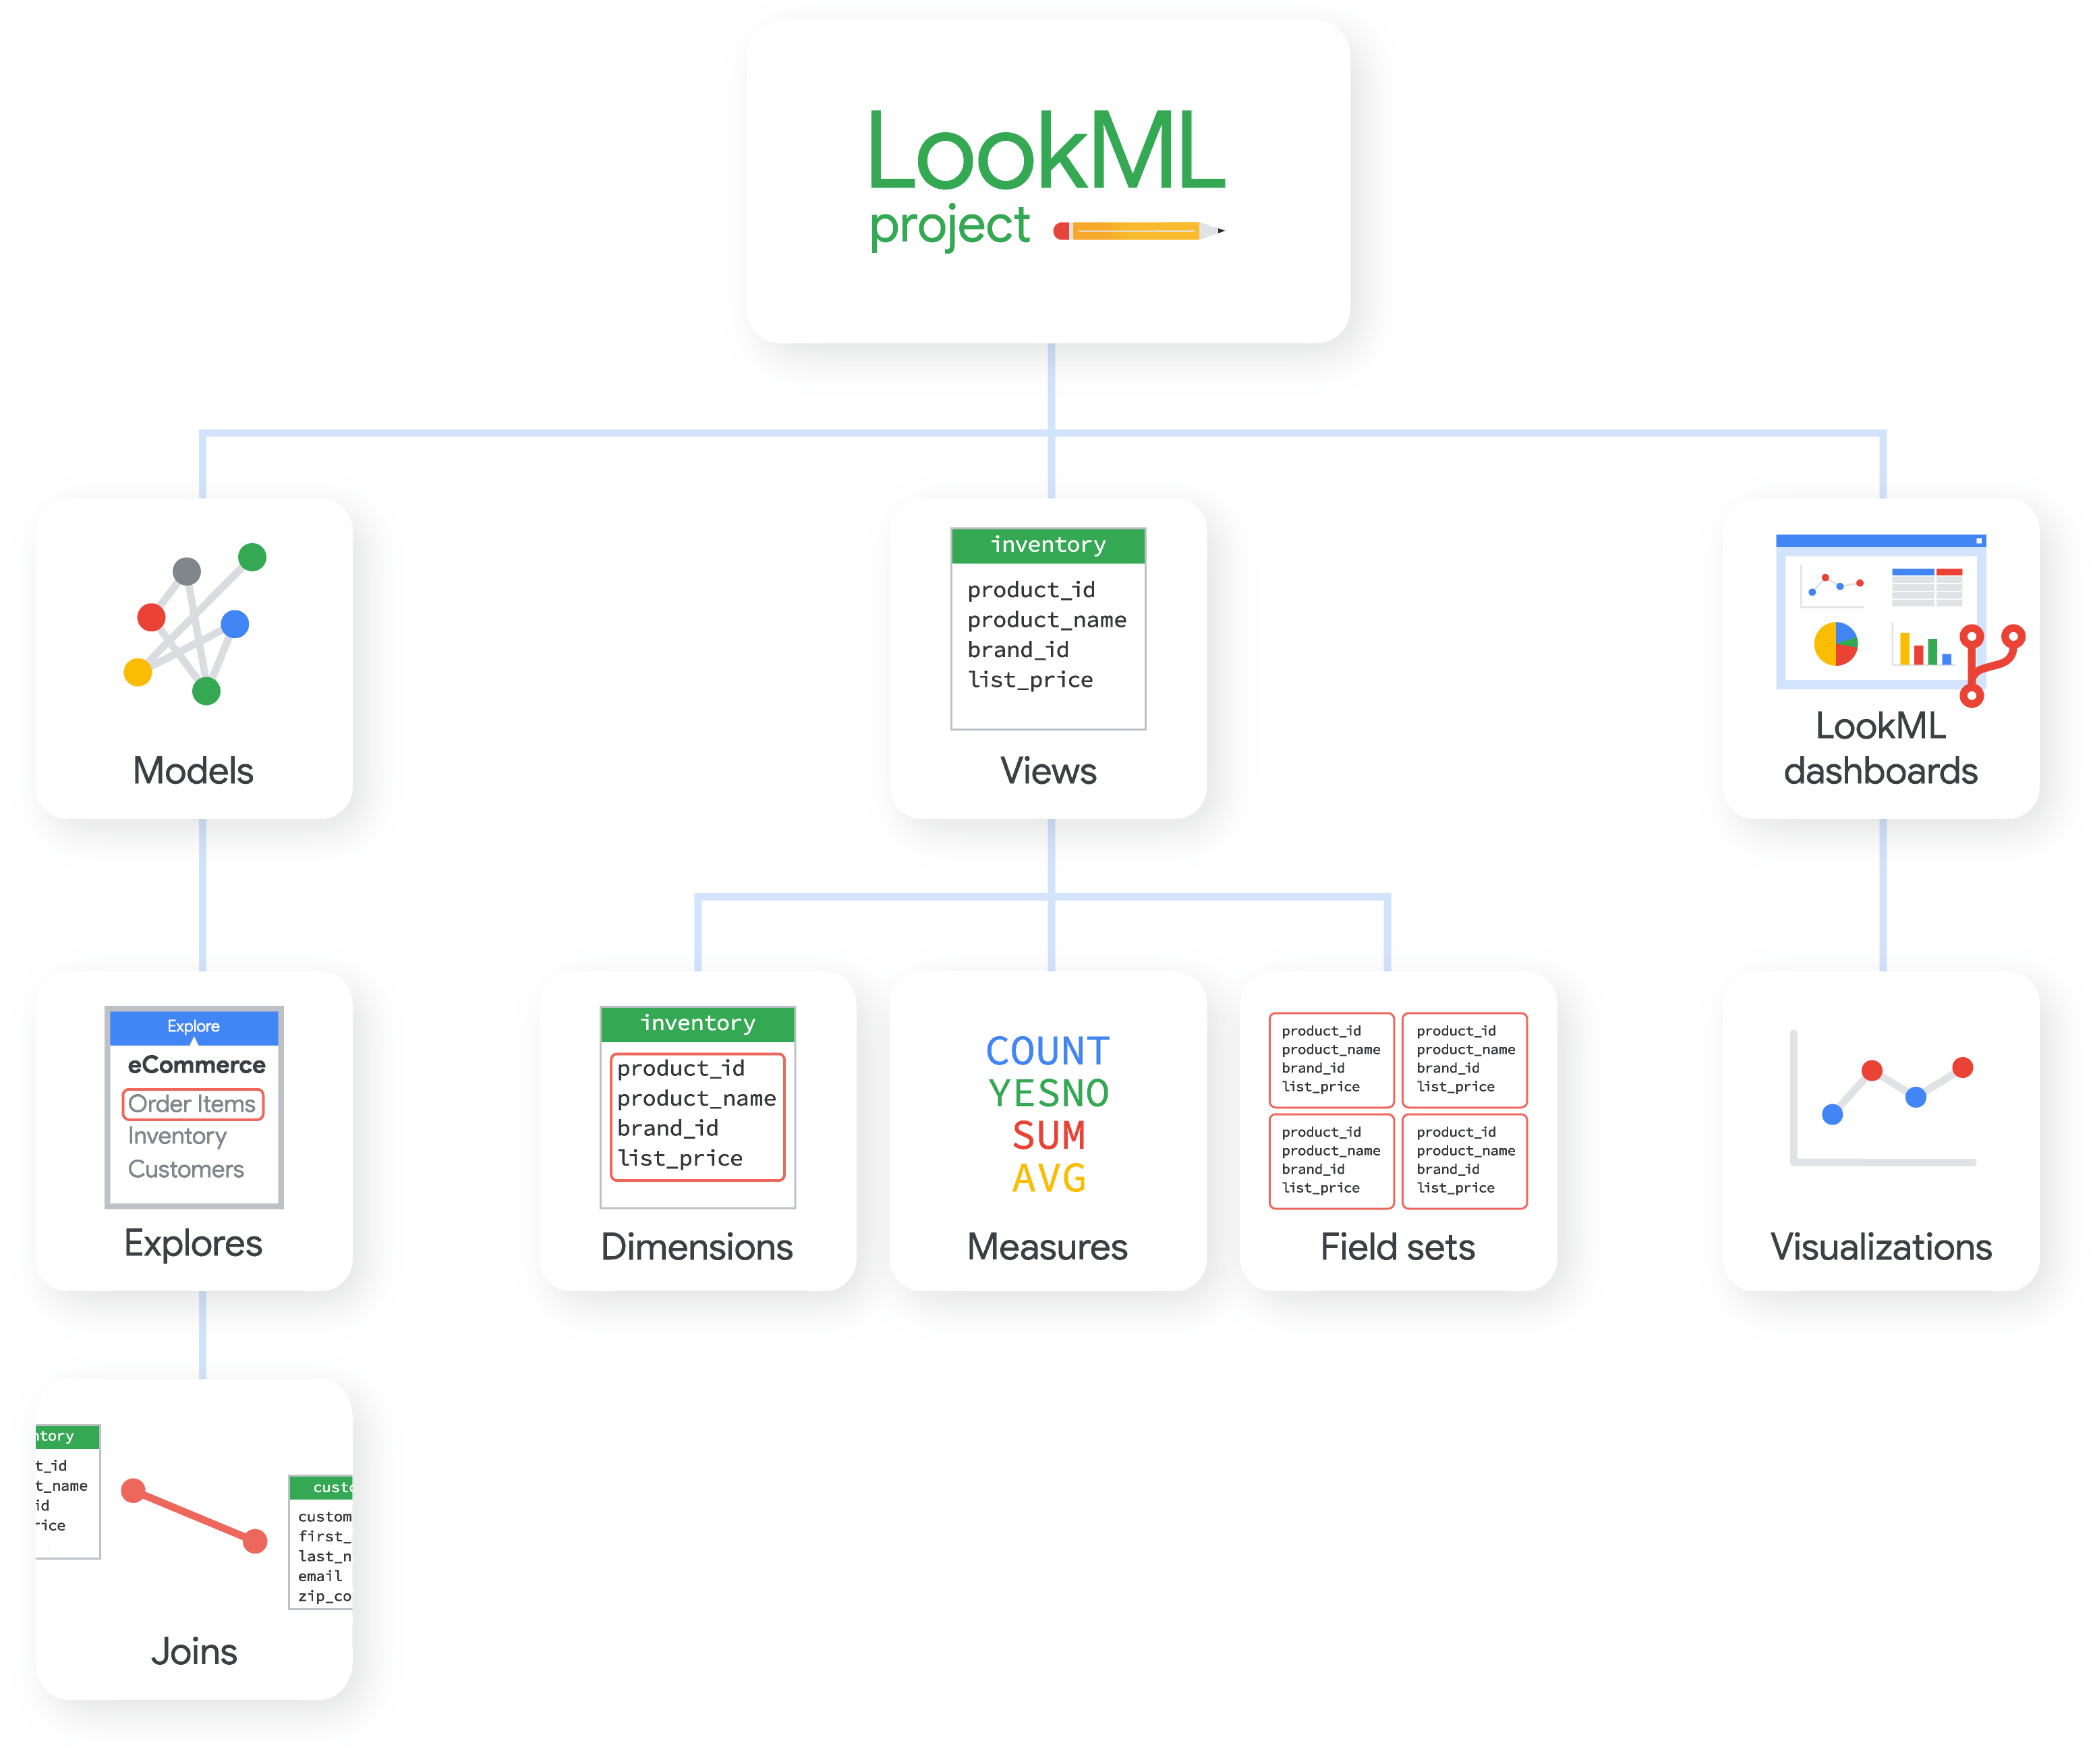 Figure 32: LookML
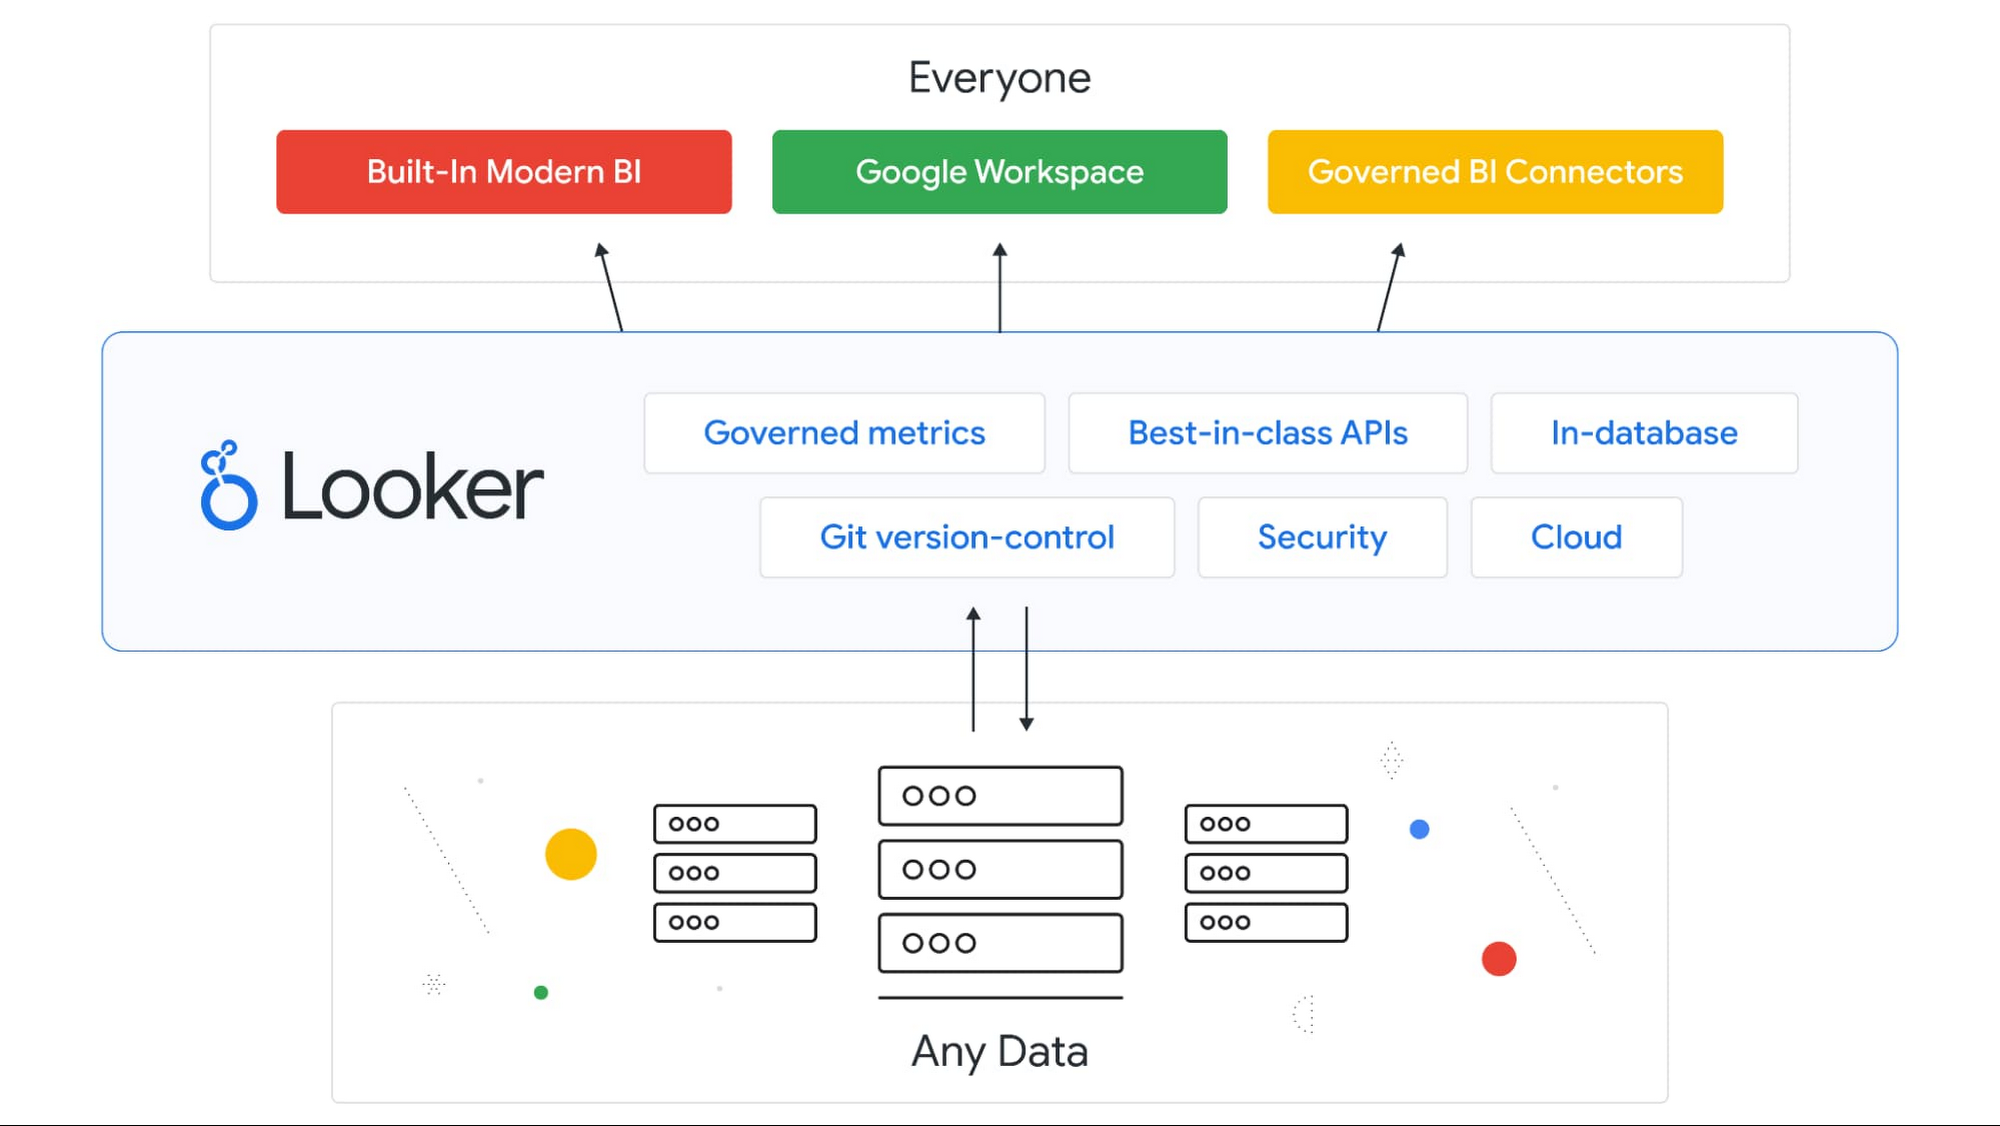 Figure 33: Looker API
12. Microsoft BI & Analytics
![]() The Business Intelligence tools from the BI & Analytics vendor Microsoft focus on the support of the following functionalities:
The Business Intelligence tools from the BI & Analytics vendor Microsoft focus on the support of the following functionalities:
- SQL
- analytics
- R
- reporting
- analysis
- IoT
- data mining
- Windows
- machine learning server
Microsoft serves the market with the following products, among others: Power BI, Microsoft Azure, Microsoft SQL Server, Azure Synapse Analytics, and Azure Stream Analytics (see the images below). We took a closer look at them.
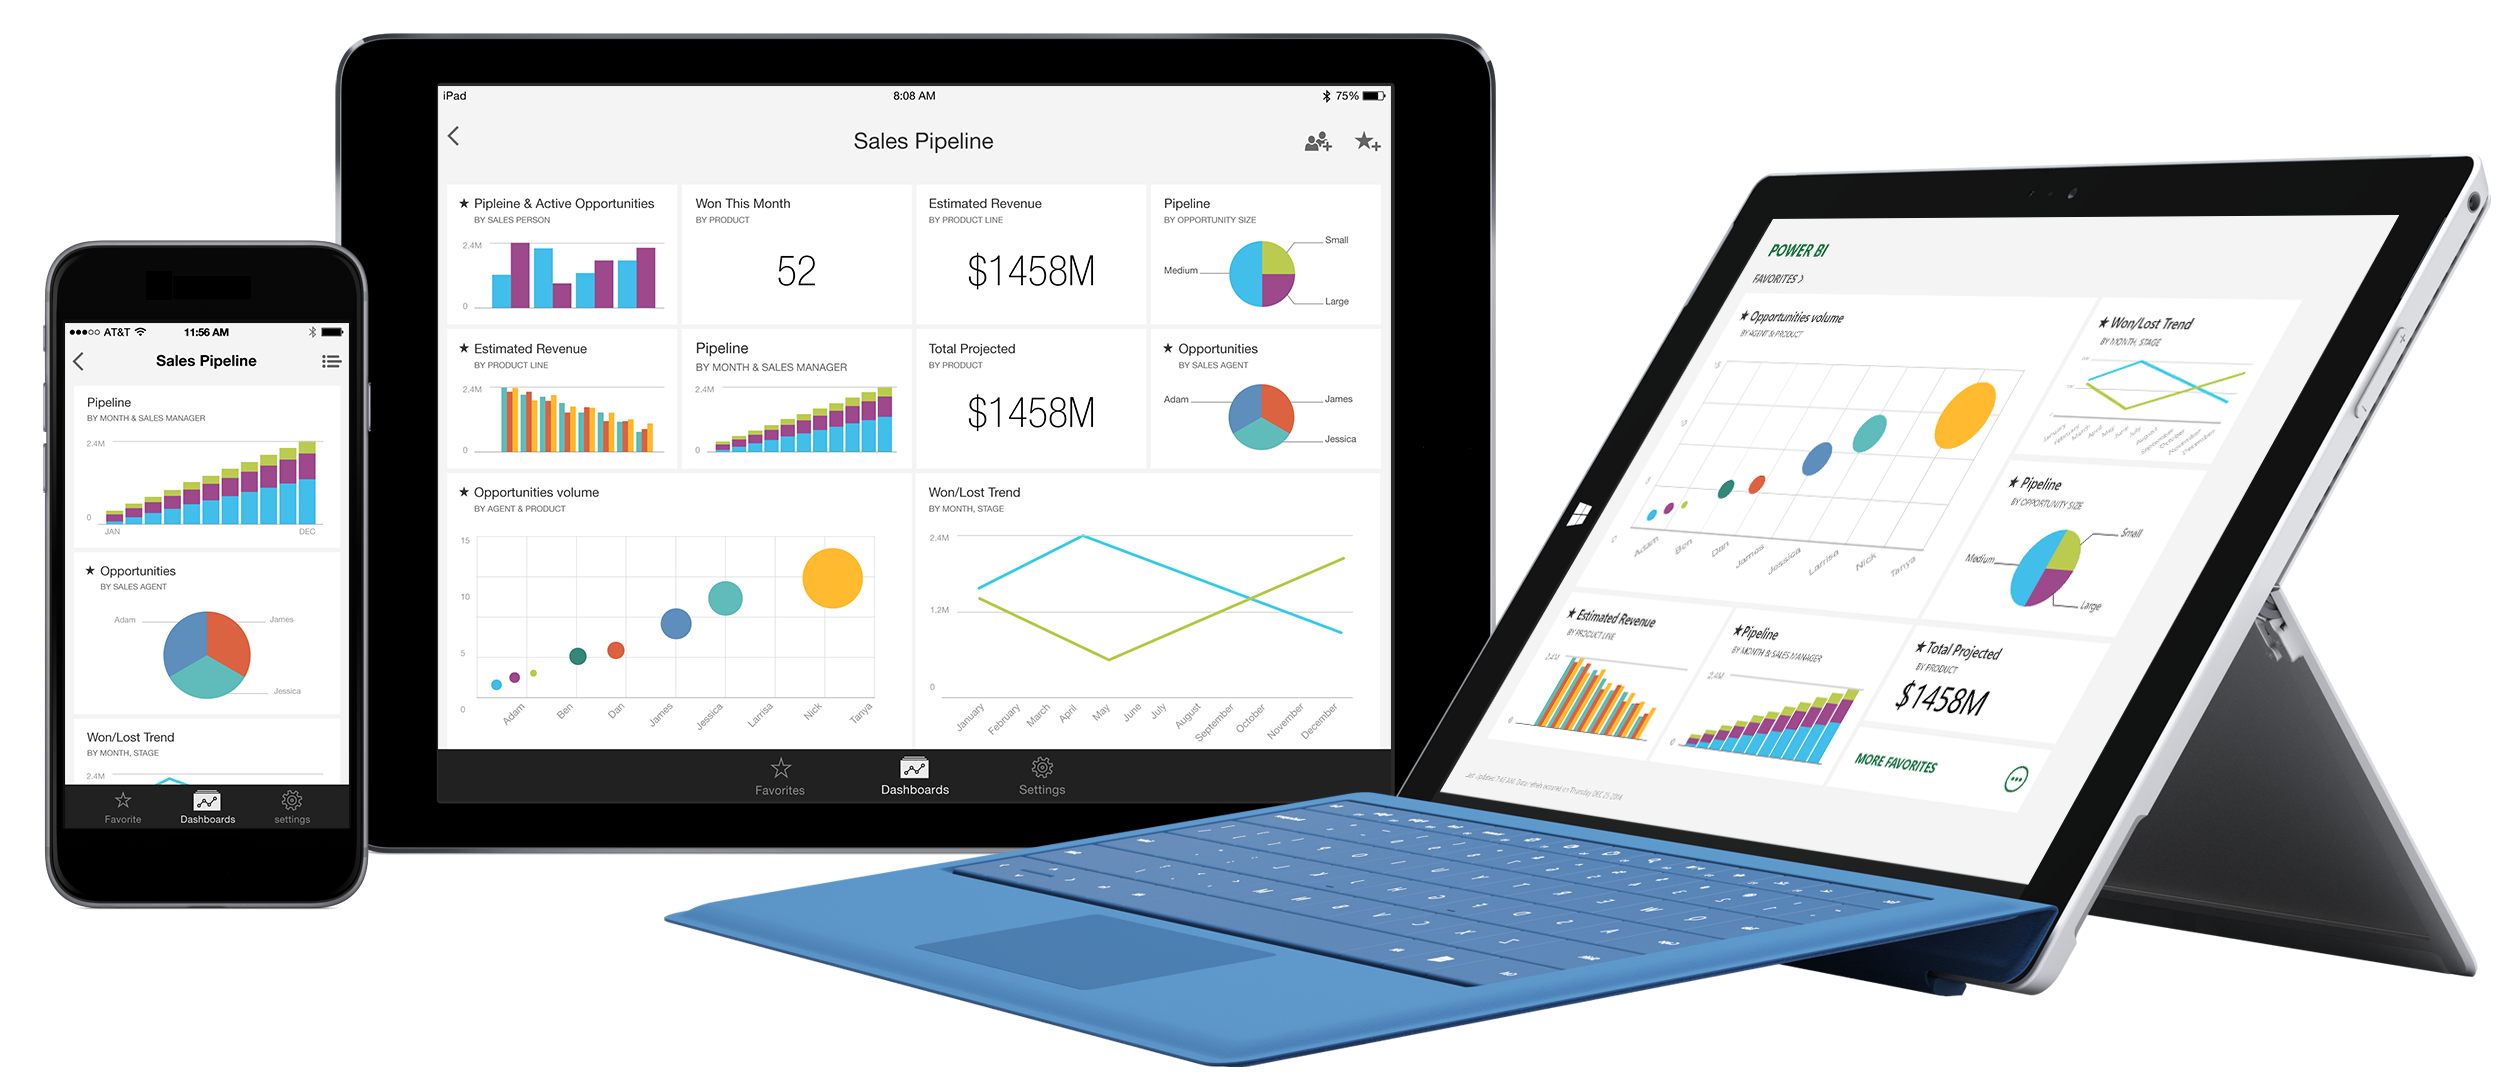 Figure 34: Power BI
 Figure 35: Microsoft Azure
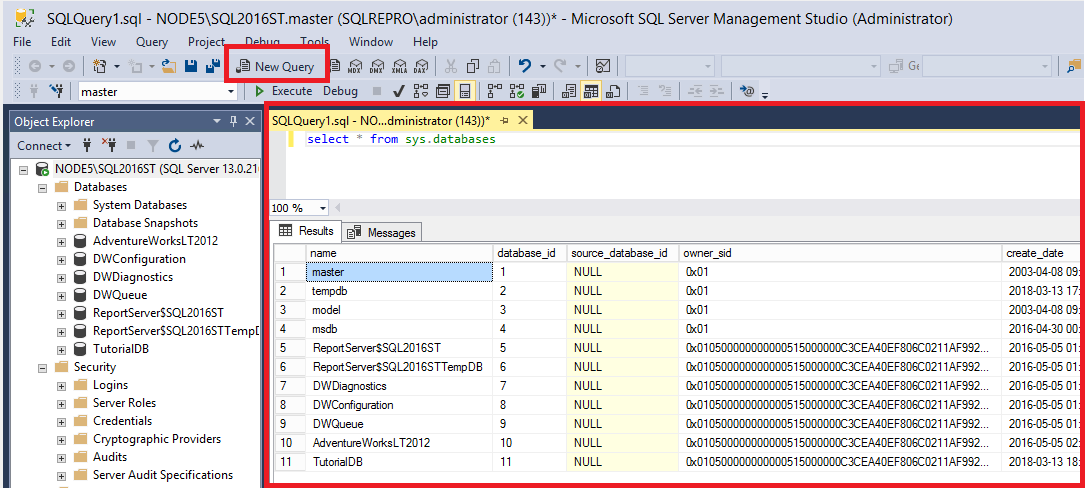 Figure 36: Microsoft SQL Server
13. Oracle BI & Analytics
![]() The most well-known products in the area of BI & Analytics of the company Oracle are Oracle Database, OBIEE, Oracle Big Data, and Oracle Analytics Server. We analyzed and evaluated these BI & Analytics products in depth and meticulously. The Business Intelligence tools from Oracle can be characterized by good support on the following topics:
The most well-known products in the area of BI & Analytics of the company Oracle are Oracle Database, OBIEE, Oracle Big Data, and Oracle Analytics Server. We analyzed and evaluated these BI & Analytics products in depth and meticulously. The Business Intelligence tools from Oracle can be characterized by good support on the following topics:
- analytics
- business intelligence
- SQL
- data quality
- big data appliance
- data management
- R
- data science
- analysis
 Figure 37: Oracle Analytics
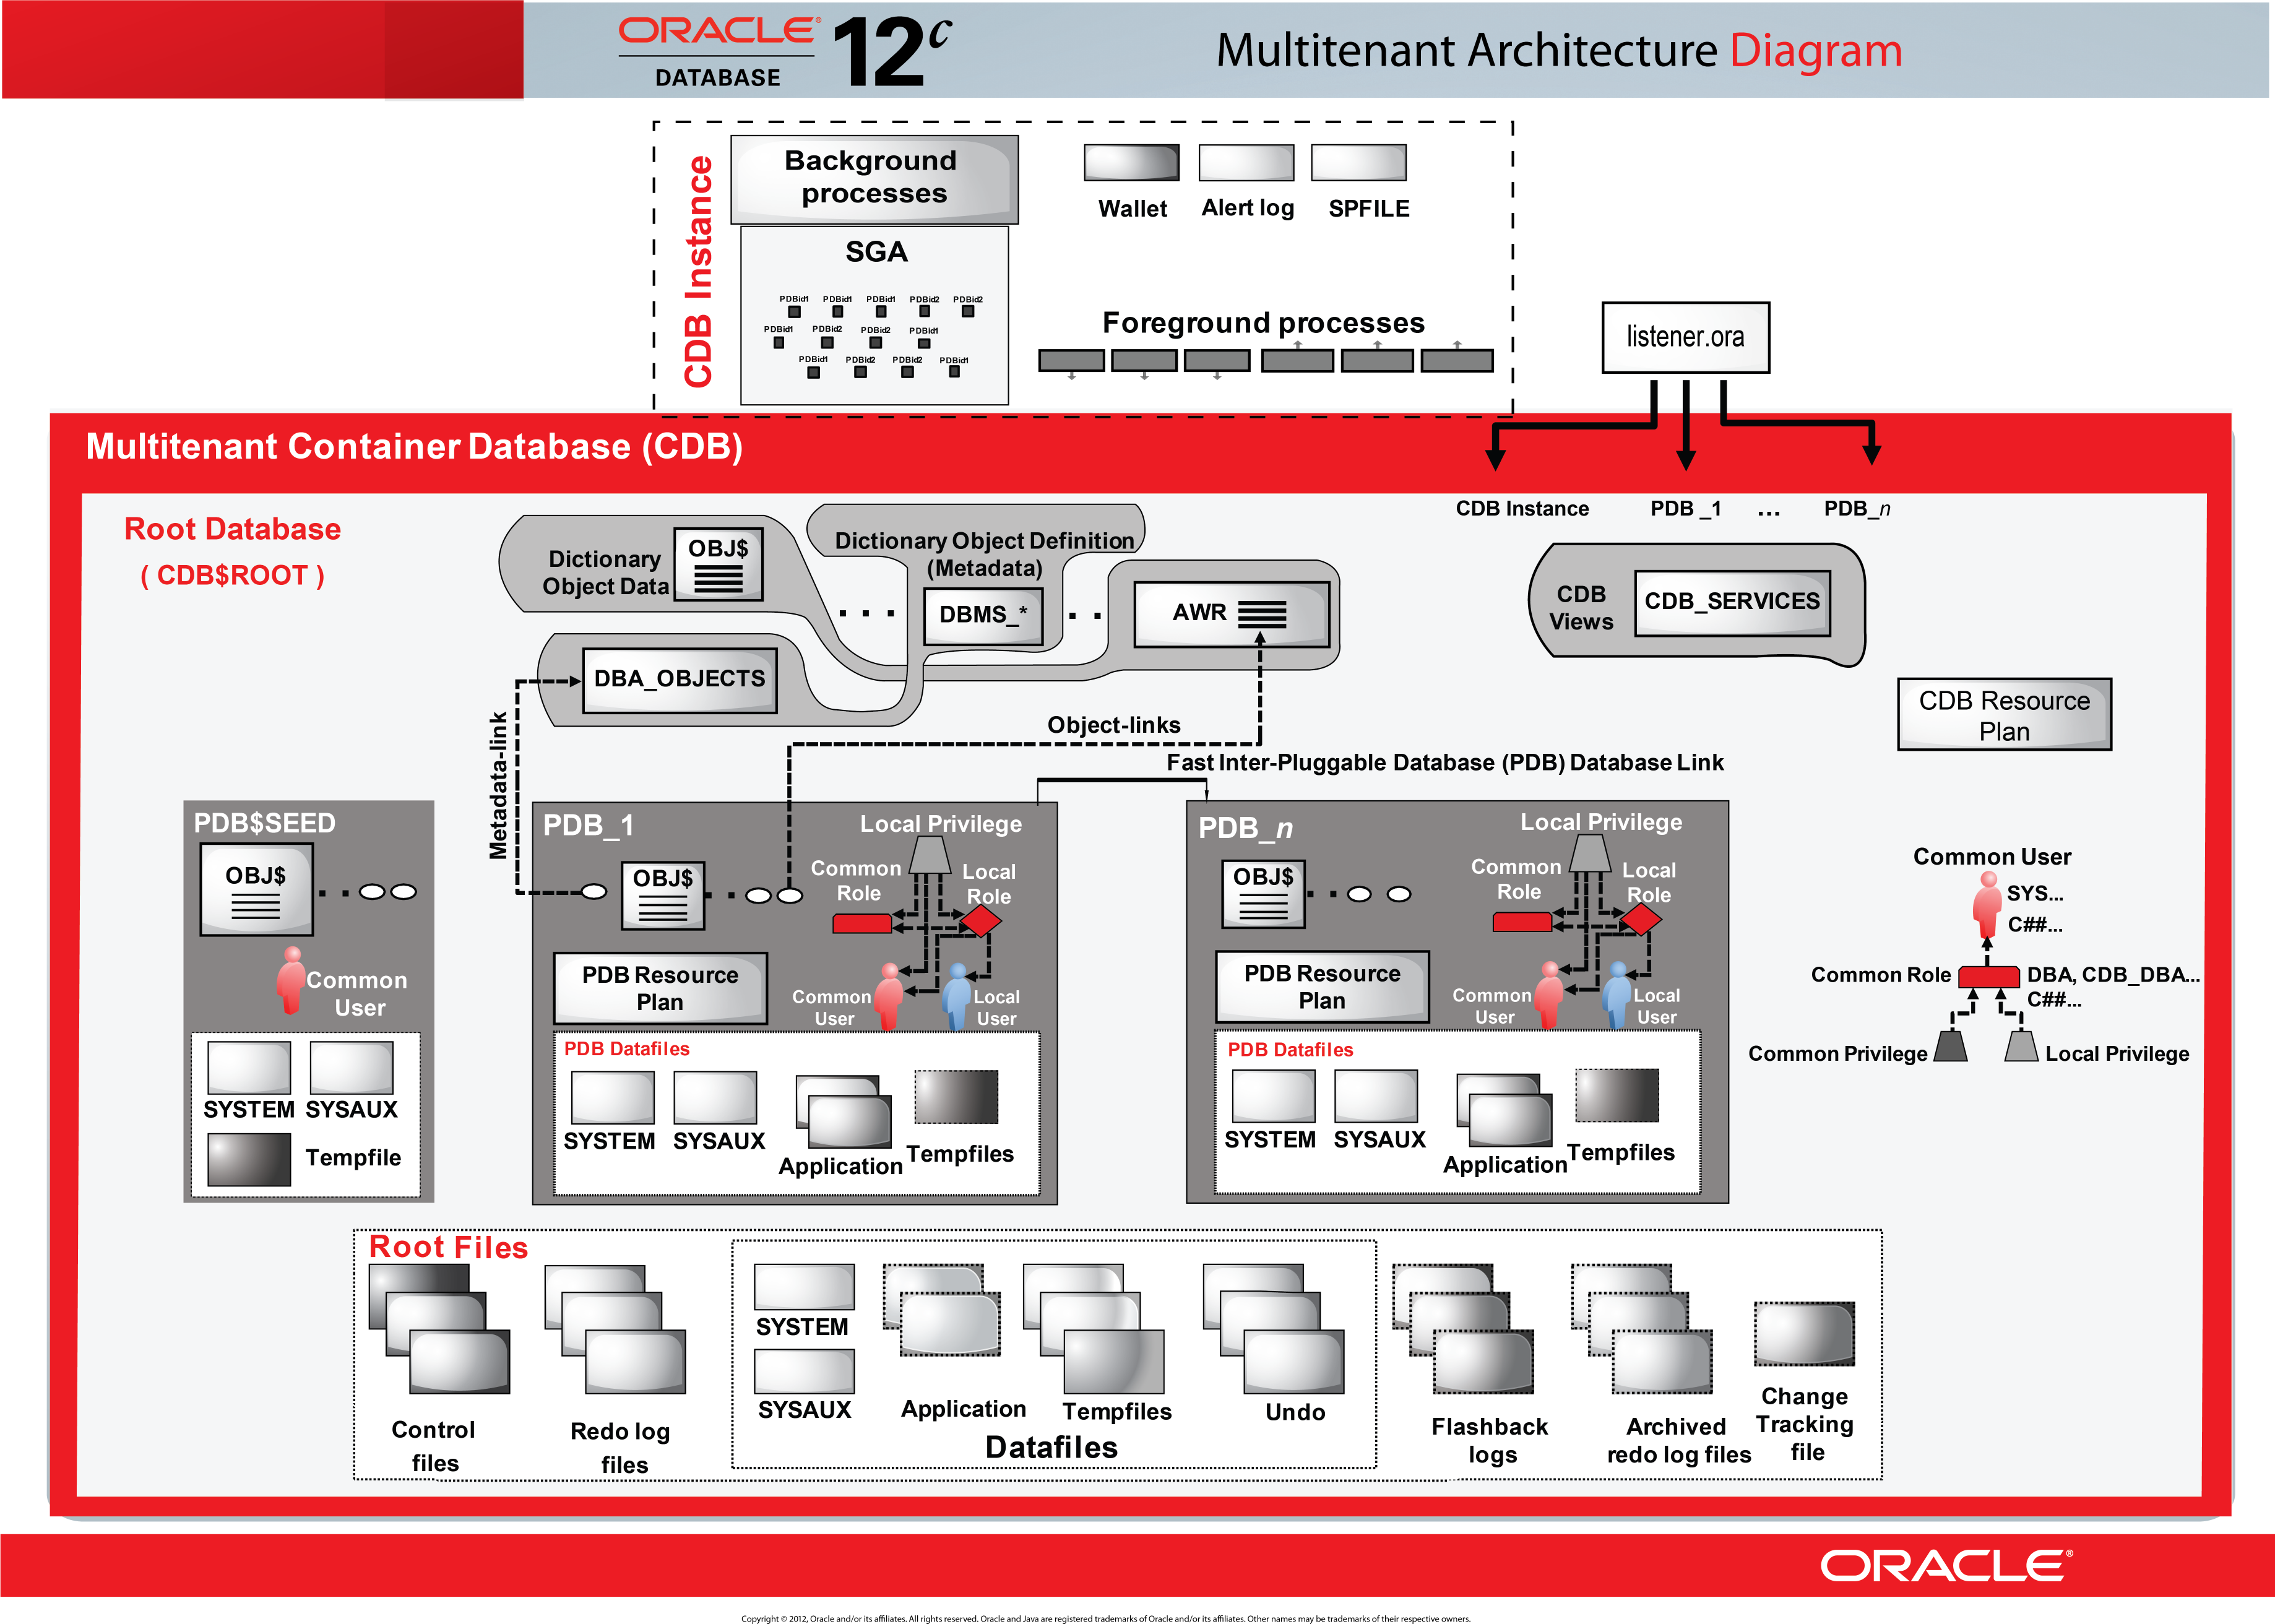 Figure 38: Oracle Database
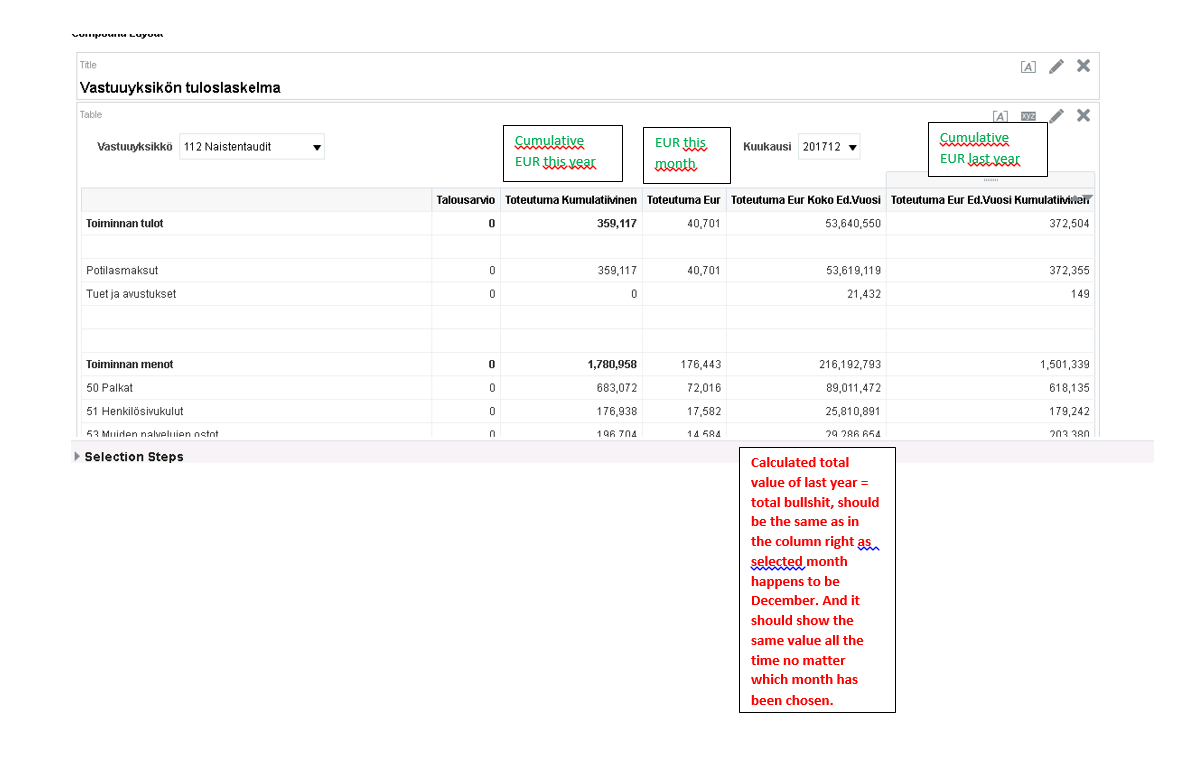 Figure 39: OBIEE
14. Pyramid Analytics
 Pyramid Analytics is widely known for its products Pyramid Analytics, Pyramid Decision Intelligence Platform, Pyramid Data Science Workbench, and Pyramid Smart Insights. The company is 100% specialized in BI & Analytics. Take a look at the images below. The Business Intelligence tools from Pyramid Analytics are strong in the following areas, among others:
- analytics
- decision intelligence
- business intelligence
- data science
- forecasting
- data discovery
- data preparation
- Python
- analysis
- repository
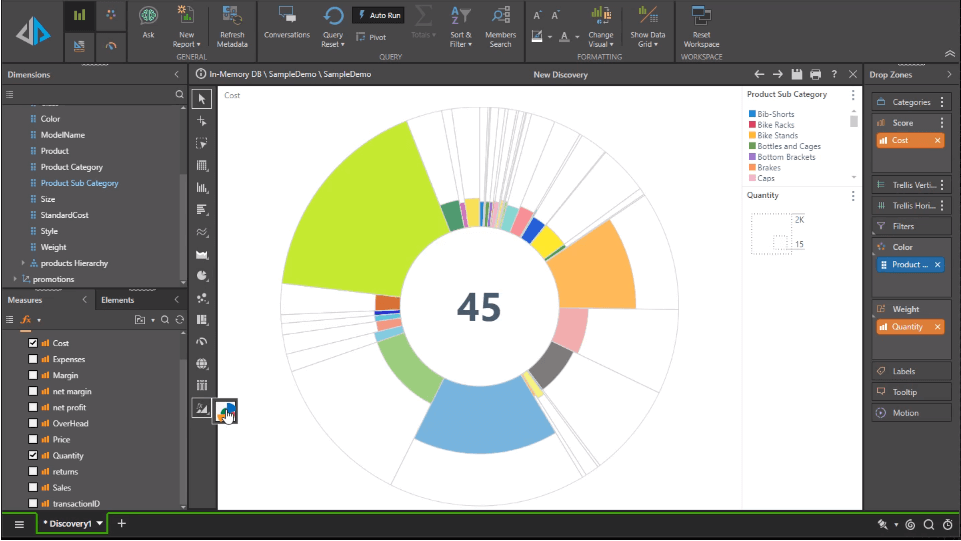 Figure 40: Pyramid Analytics
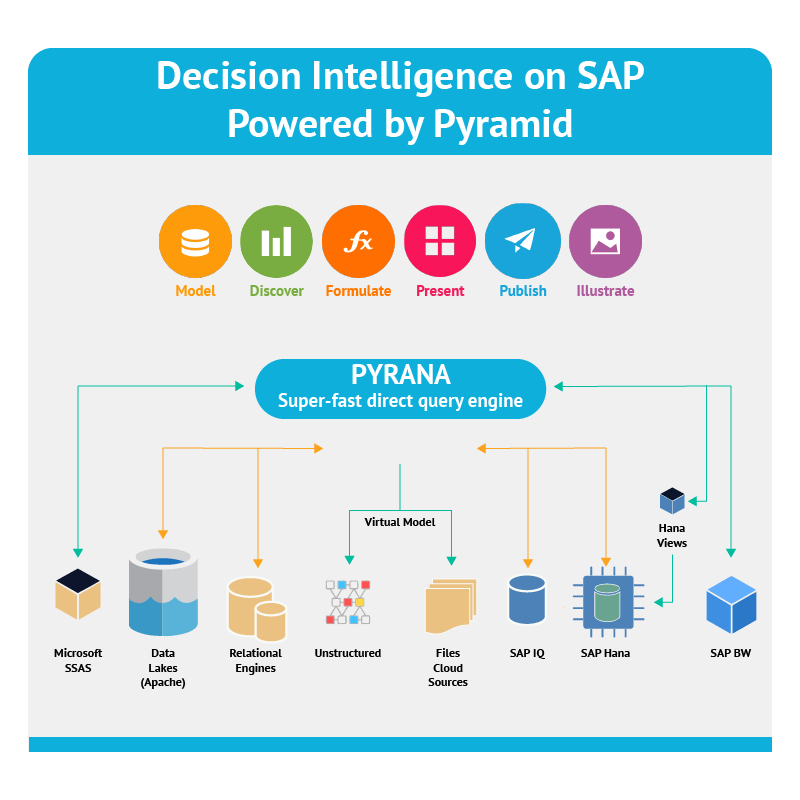 Figure 41: Pyramid Decision Intelligence Platform
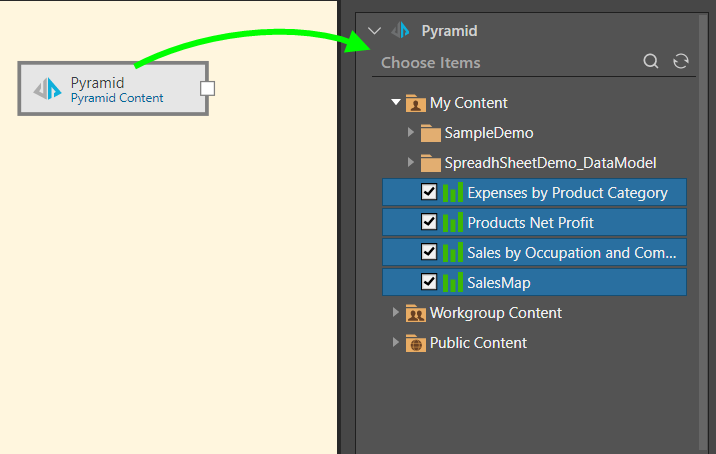 Figure 42: Pyramid Data Science Workbench
15. Qlik
![]() Qlik is widely known for its products QlikView, Qlik Sense Enterprise, Qlik Replicate, and Qlik NPrinting. The company is 100% specialized in BI & Analytics. Take a look at the images below. The Business Intelligence tools from Qlik are strong in the following areas, among others:
Qlik is widely known for its products QlikView, Qlik Sense Enterprise, Qlik Replicate, and Qlik NPrinting. The company is 100% specialized in BI & Analytics. Take a look at the images below. The Business Intelligence tools from Qlik are strong in the following areas, among others:
- geoanalytics
- Windows
- reporting
- big data
- analytics platform
- analysis
- SaaS
- data integration platform
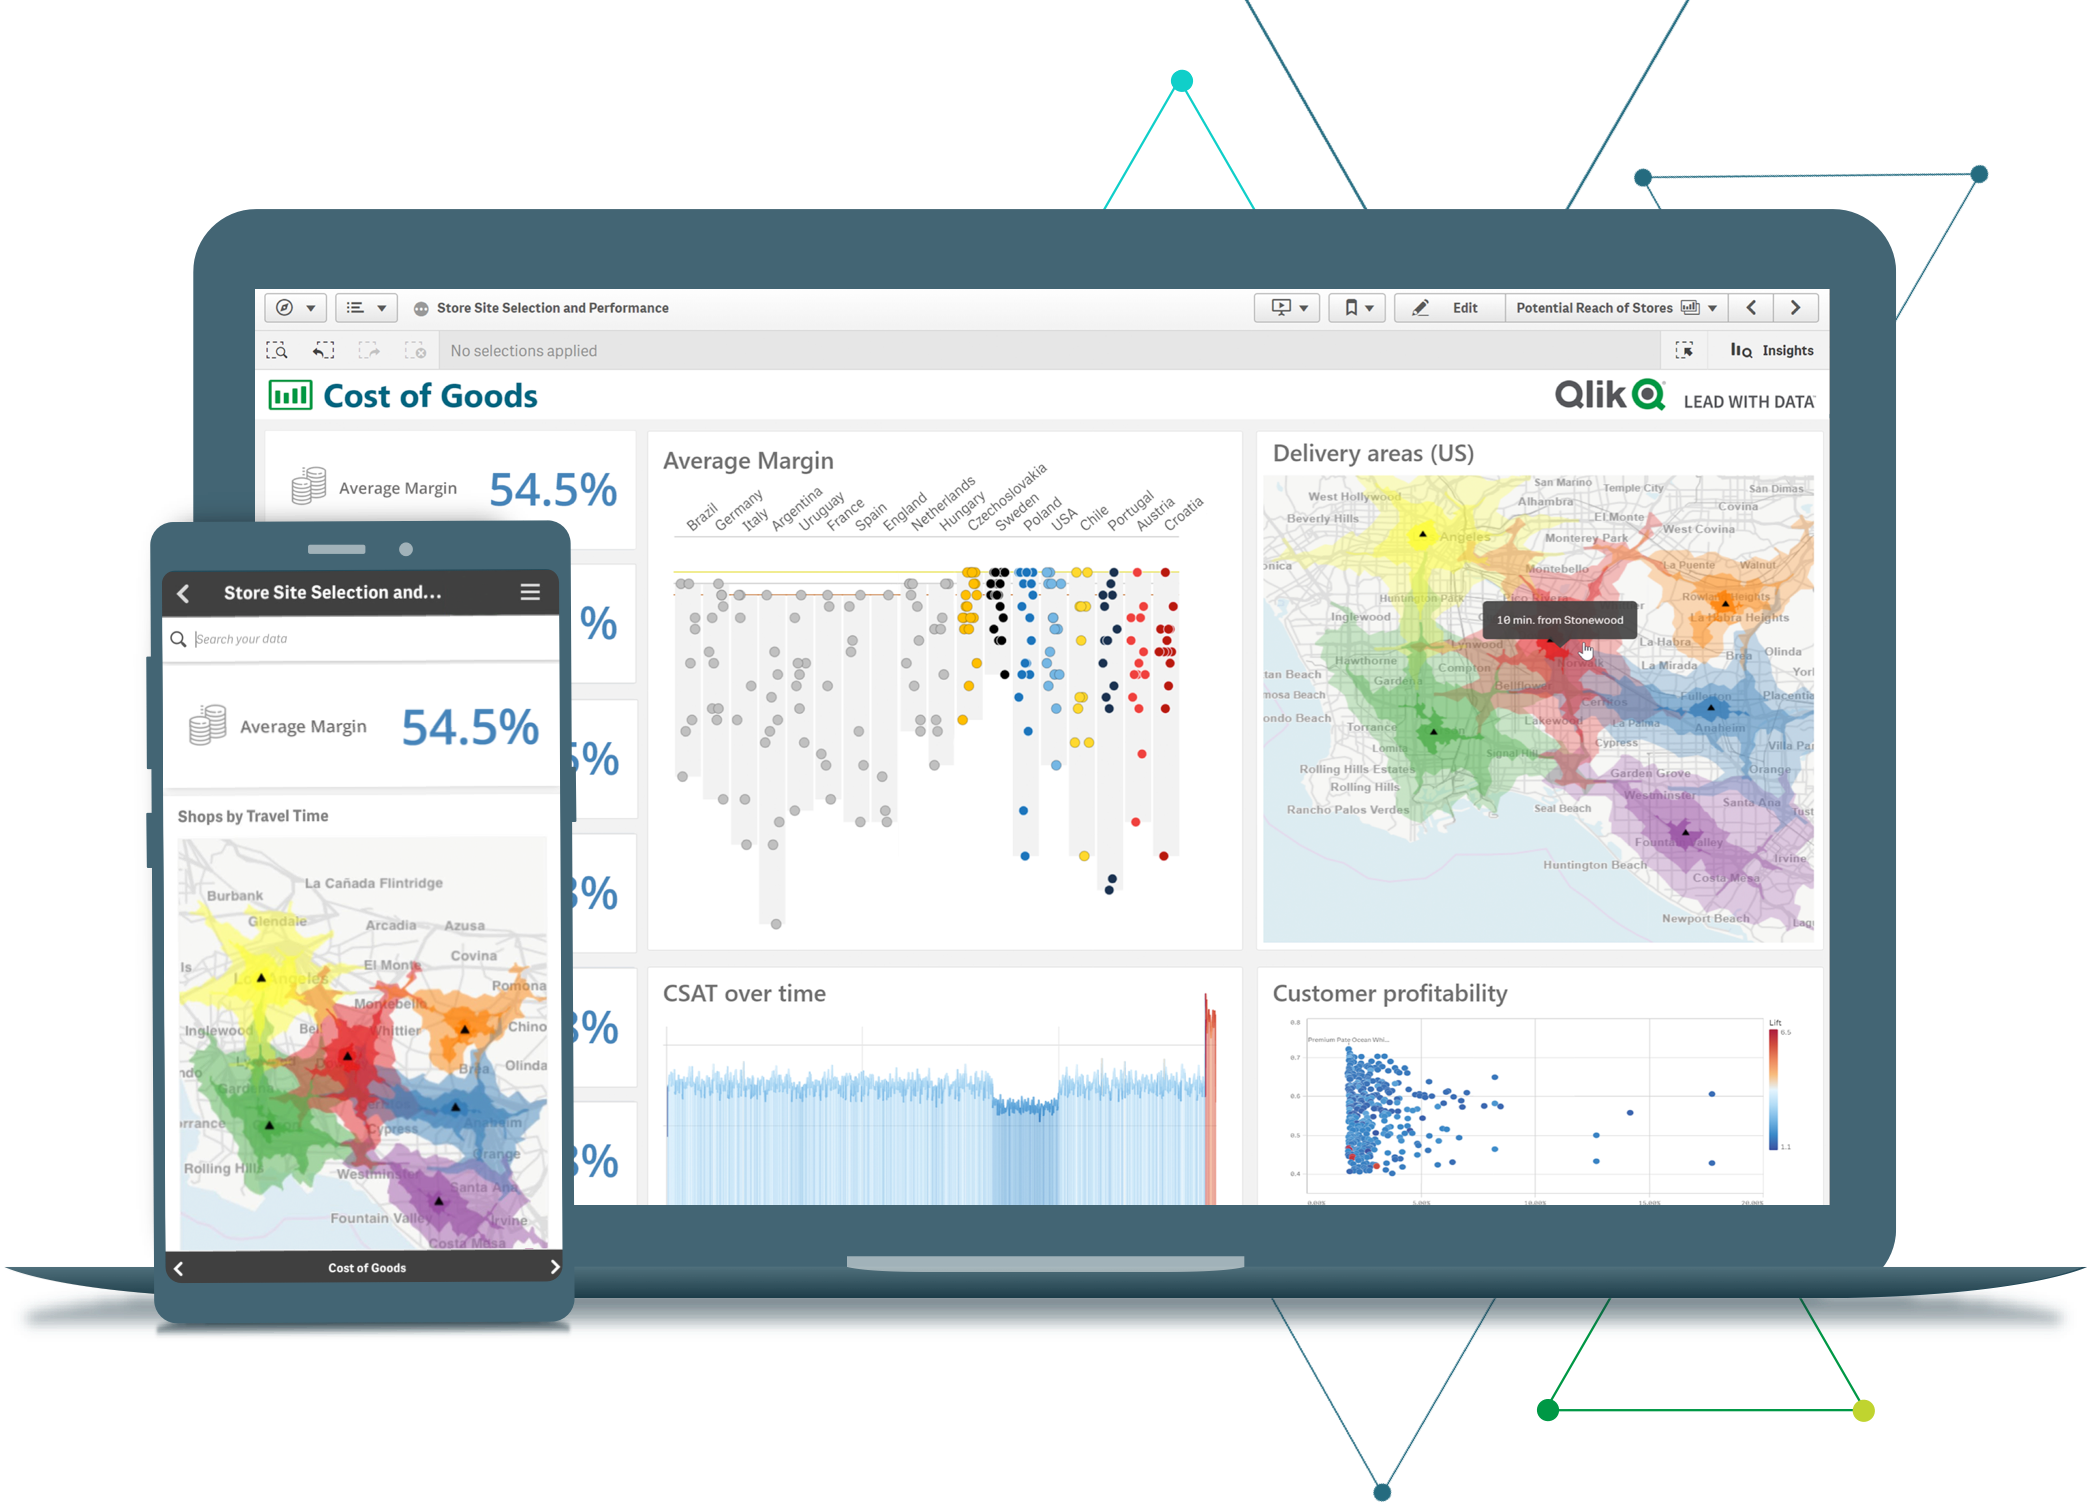 Figure 43: Qlik Sense
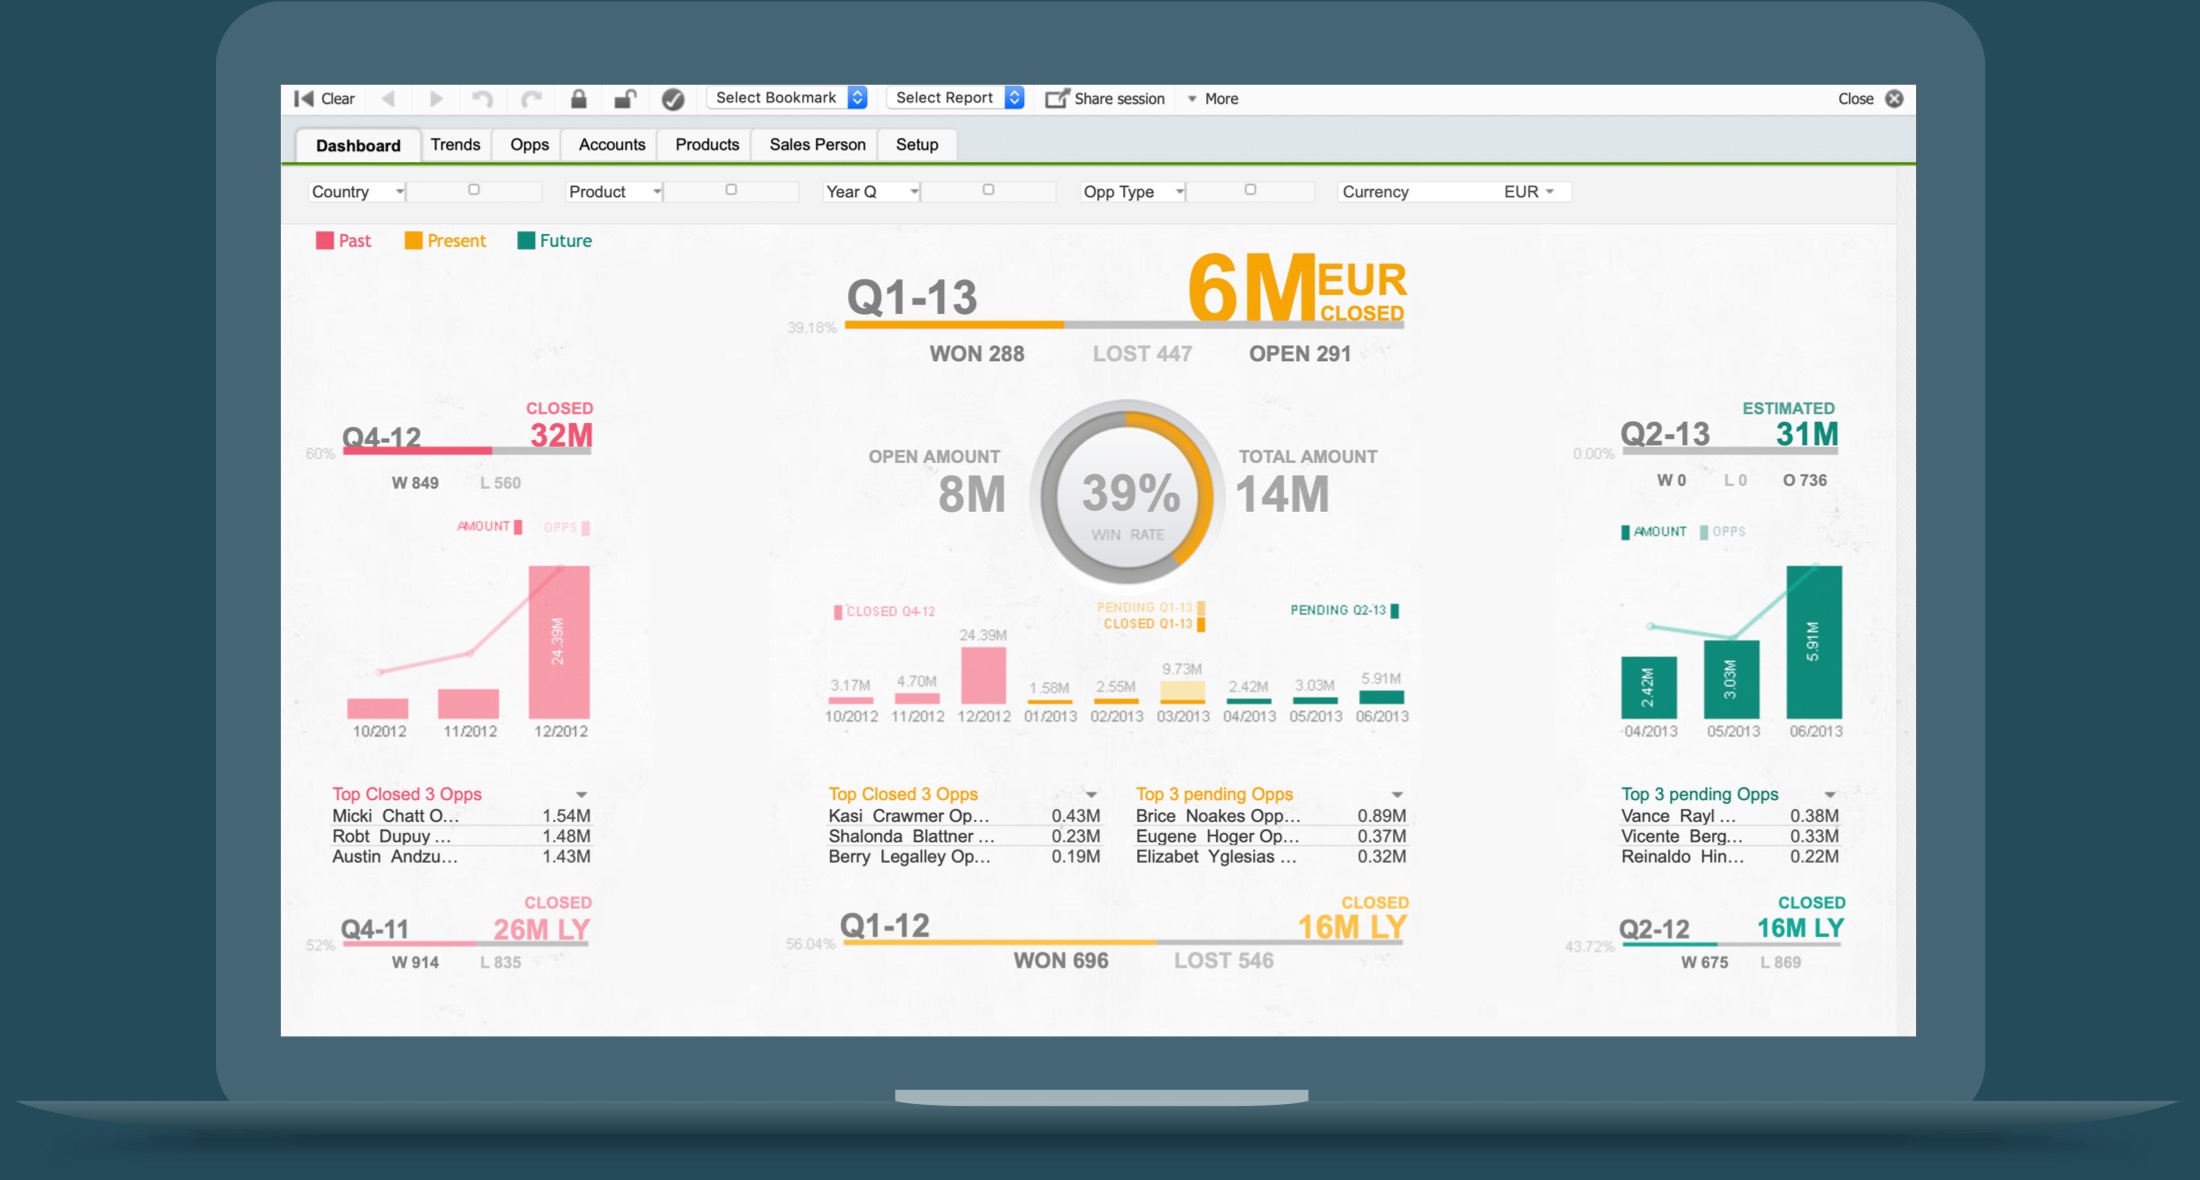 Figure 44: QlikView
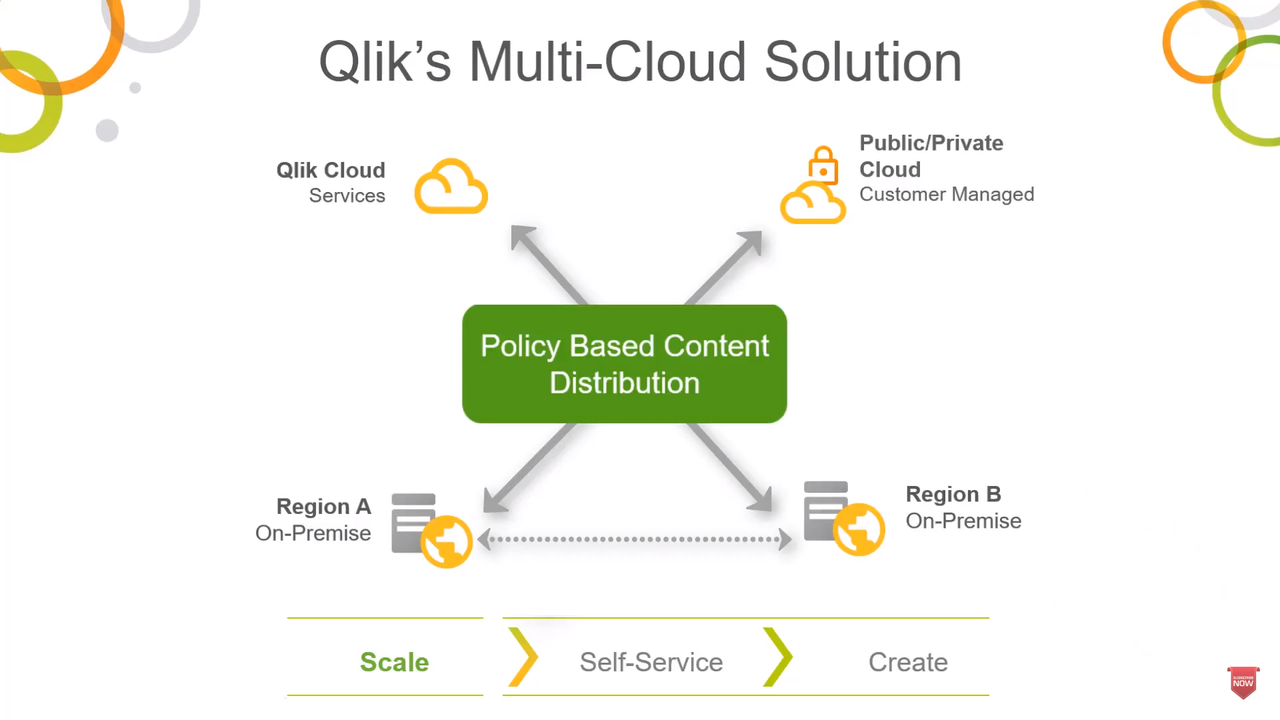 Figure 45: Qlik Sense Enterprise
16. SAP BI & Analytics
![]() The Business Intelligence tools from the BI & Analytics vendor SAP focus on the support of the following functionalities:
The Business Intelligence tools from the BI & Analytics vendor SAP focus on the support of the following functionalities:
- analytics
- business intelligence
- analysis
- dashboards
- machine learning
- reporting
- predictive analytics
- data management
- data hub
- SQL
SAP serves the market with the following products, among others: SAP HANA, SAP Analytics Cloud, SAP BusinessObjects, and SAP BW (see the images below). We took a closer look at them.
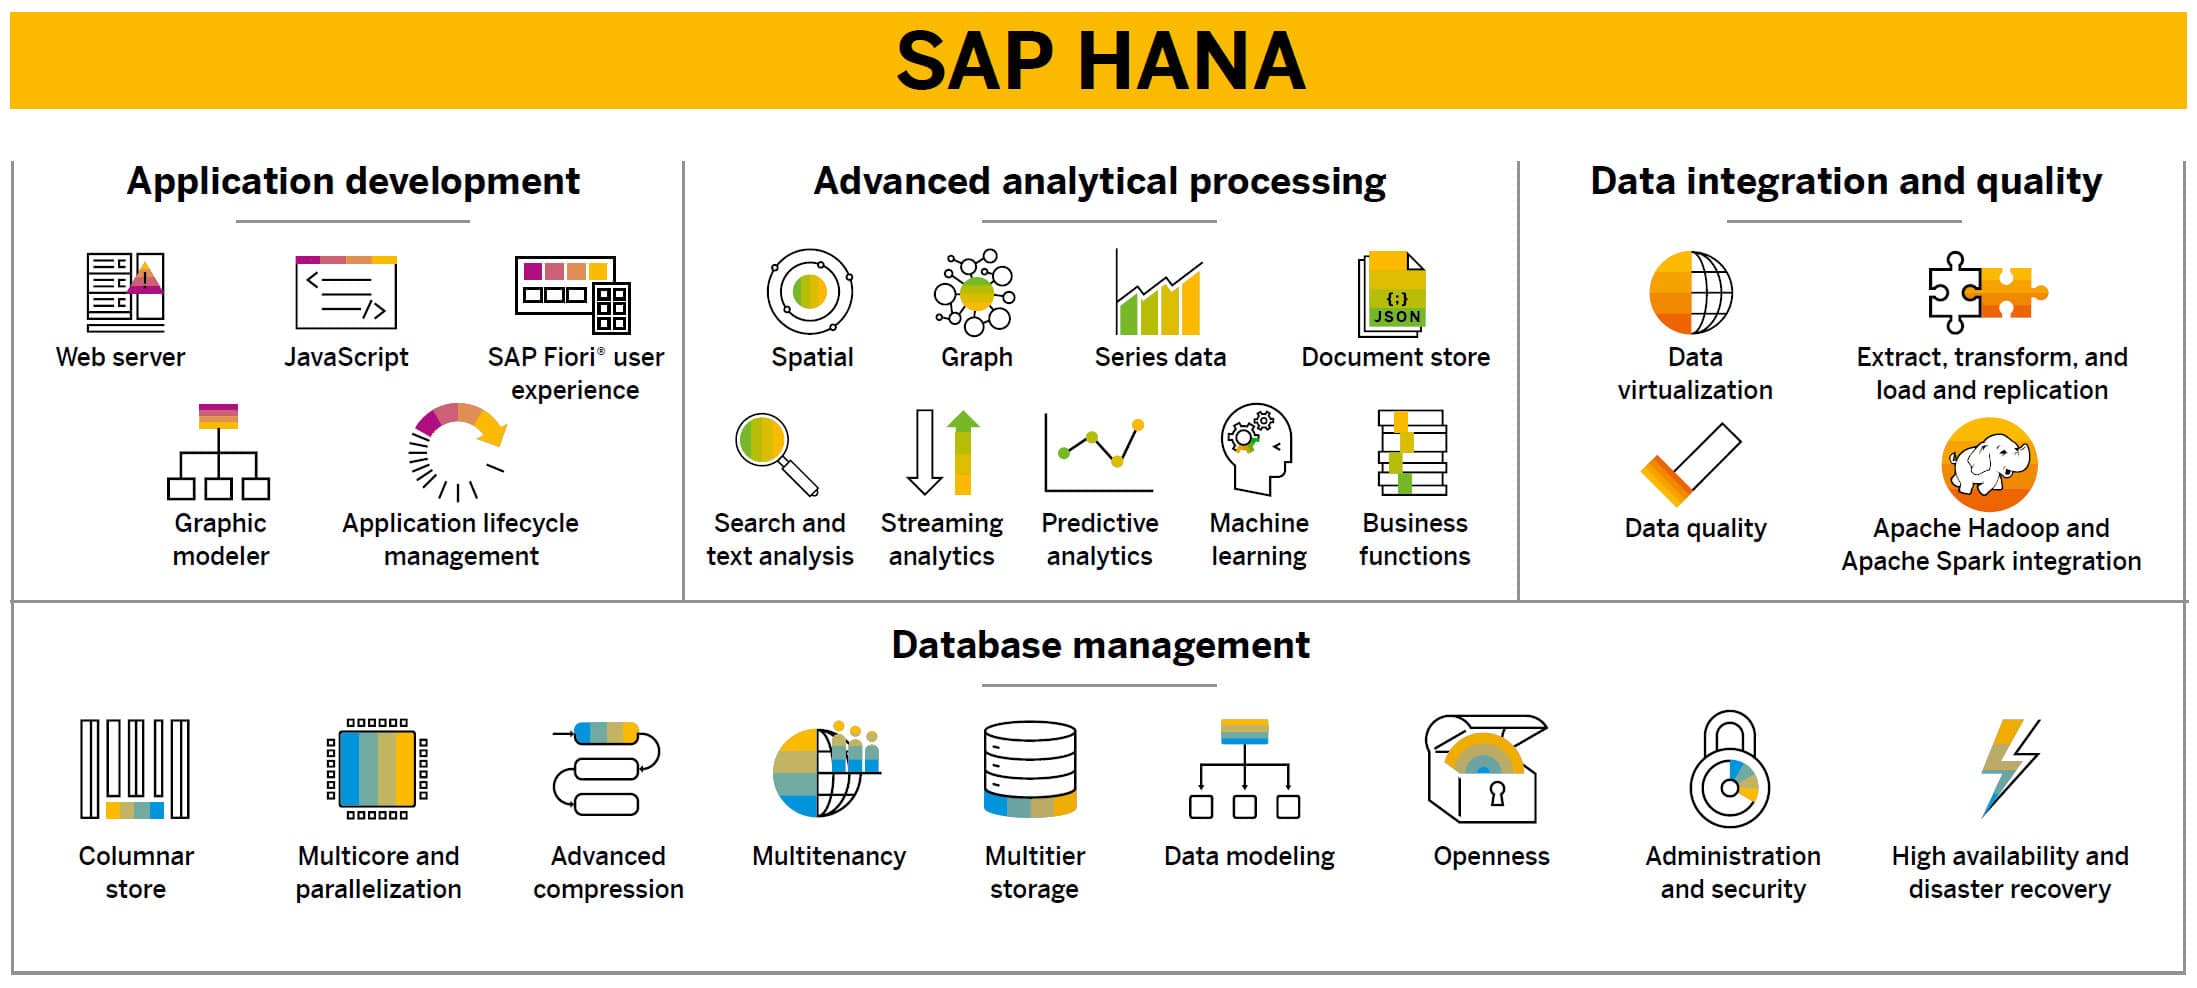 Figure 46: SAP HANA
 Figure 47: SAP Analytics Cloud
 Figure 48: SAP BusinessObjects
17. SAS
![]() SAS is widely known for its products SAS Viya, SAS Visual Analytics, Dataflux, SAS/ACCESS, and SAS Enterprise Guide. The company is 100% specialized in BI & Analytics. Take a look at the images below. The Business Intelligence tools from SAS are strong in the following areas, among others:
SAS is widely known for its products SAS Viya, SAS Visual Analytics, Dataflux, SAS/ACCESS, and SAS Enterprise Guide. The company is 100% specialized in BI & Analytics. Take a look at the images below. The Business Intelligence tools from SAS are strong in the following areas, among others:
- analytics
- visual analytics
- forecasting
- data management
- data integration
- OLAP
- analysis
- data quality
- machine learning
- customer intelligence
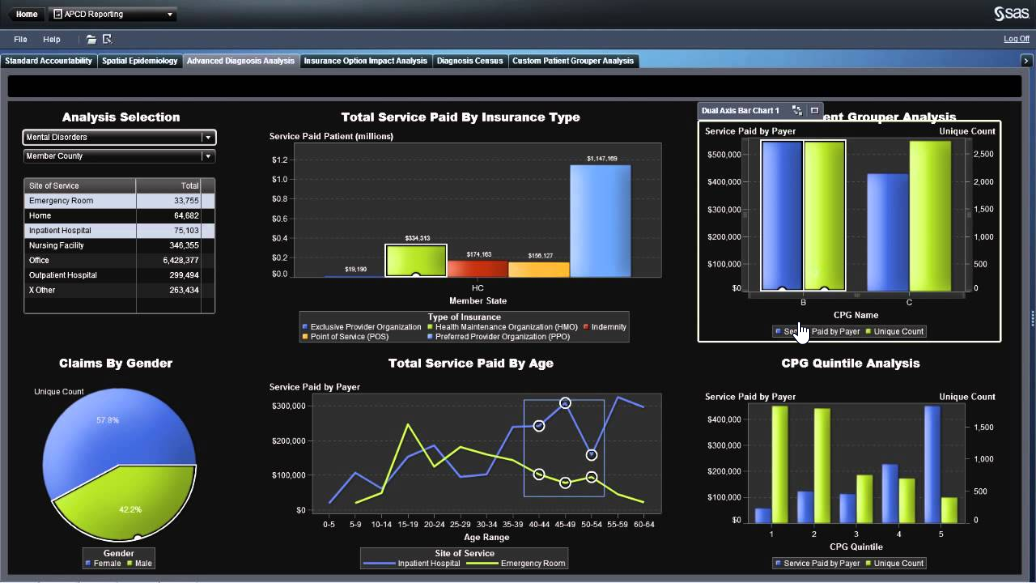 Figure 49: SAS Viya
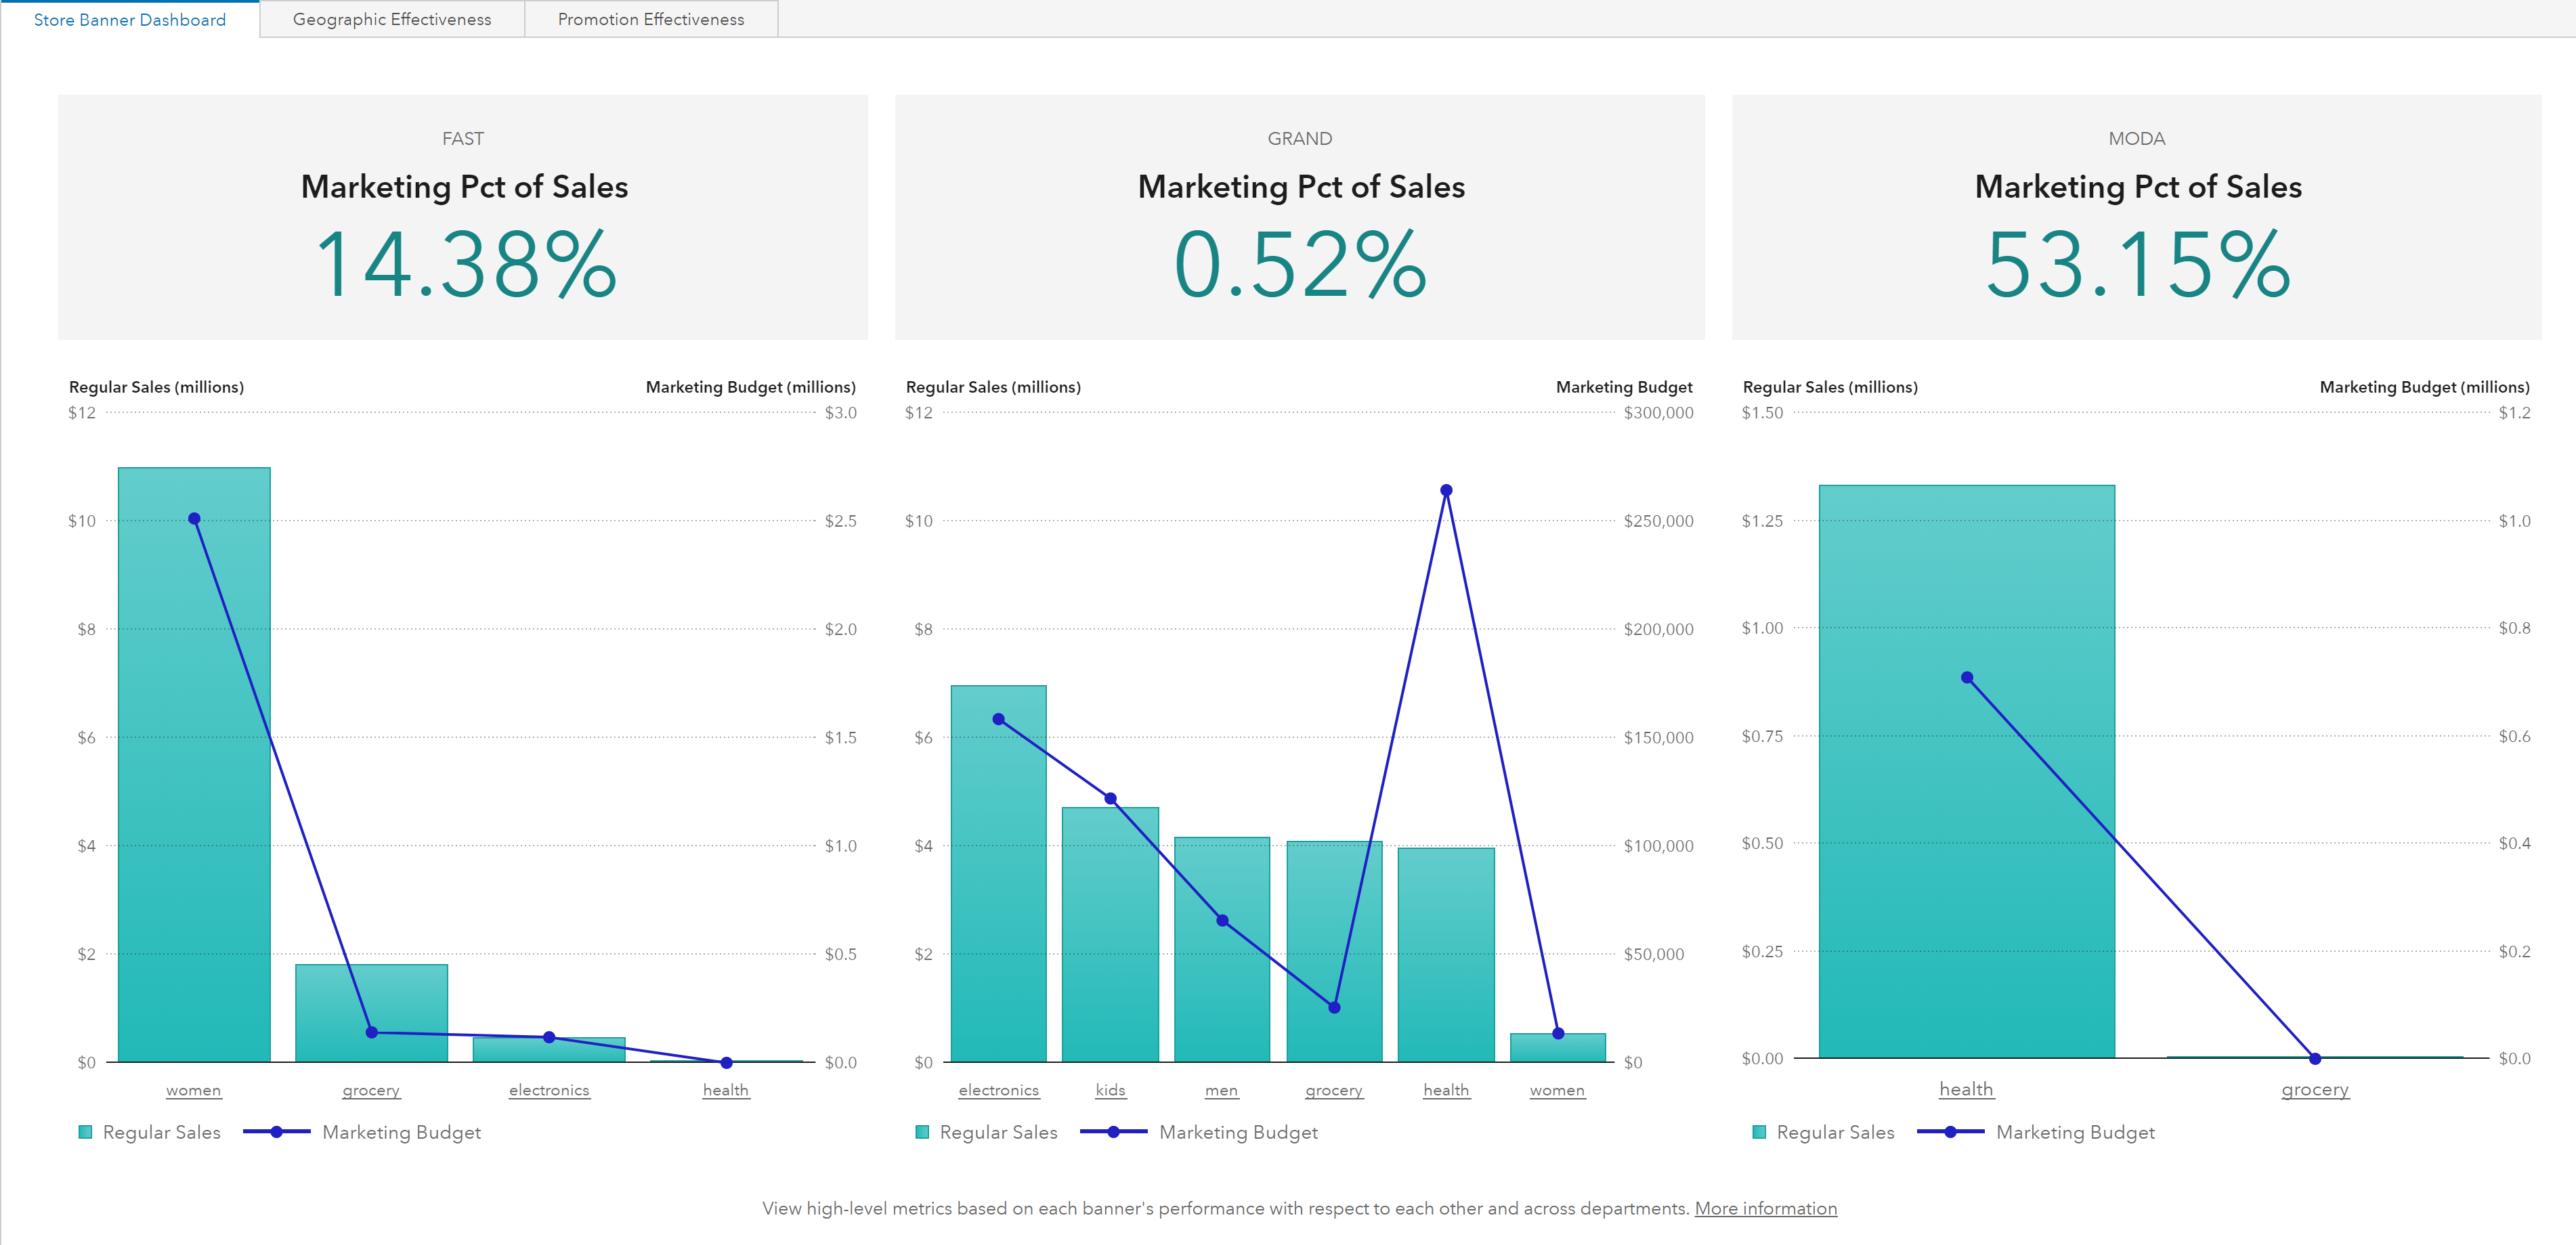 Figure 50: SAS Visual Analytics
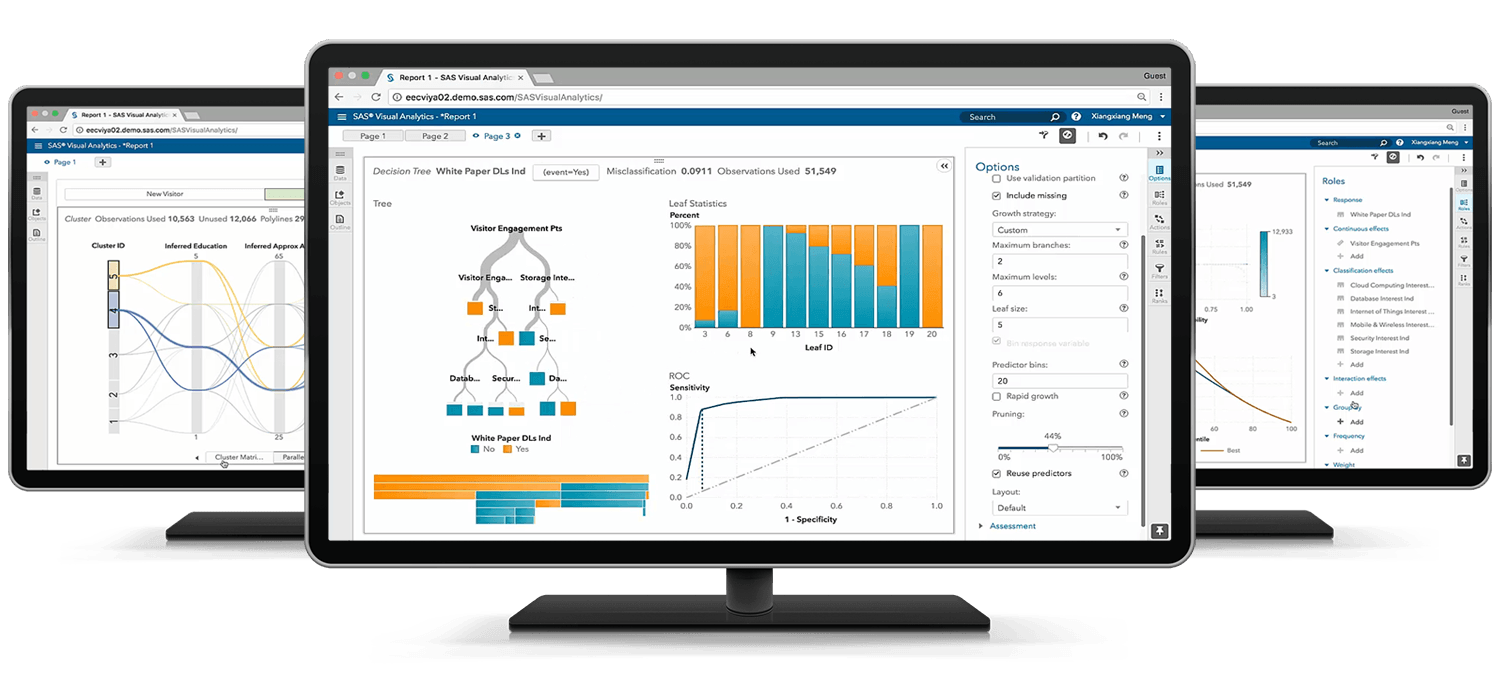 Figure 51: Dataflux
18. Sisense
![]() Sisense is widely known for its products Elasticube Manager, Sisense Analytics, Sisense ElastiCube, and Sisense Blox. The company is 100% specialized in BI & Analytics. Take a look at the images below. The Business Intelligence tools from Sisense are strong in the following areas, among others:
Sisense is widely known for its products Elasticube Manager, Sisense Analytics, Sisense ElastiCube, and Sisense Blox. The company is 100% specialized in BI & Analytics. Take a look at the images below. The Business Intelligence tools from Sisense are strong in the following areas, among others:
- dashboards
- business intelligence
- embedded analytics
- analytics platform
- data mining
- usage analytics
- predictive analytics
- forecasting
- complex data
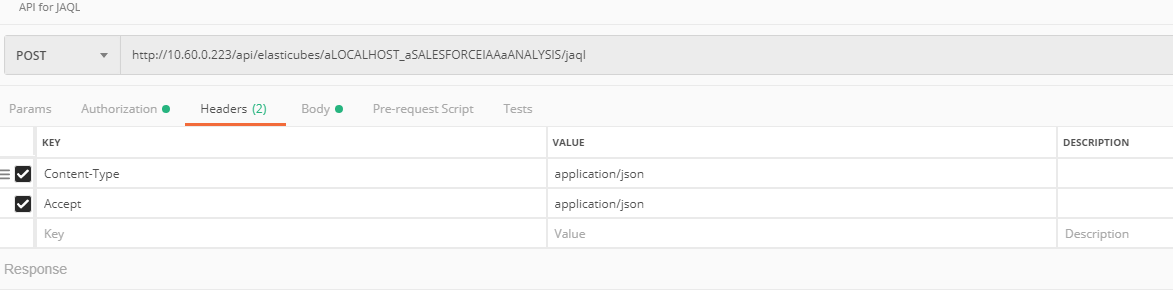 Figure 52: Elasticube
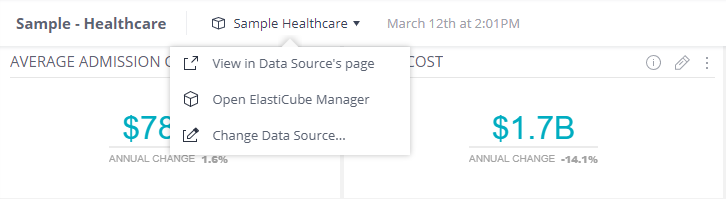 Figure 53: Elasticube Manager
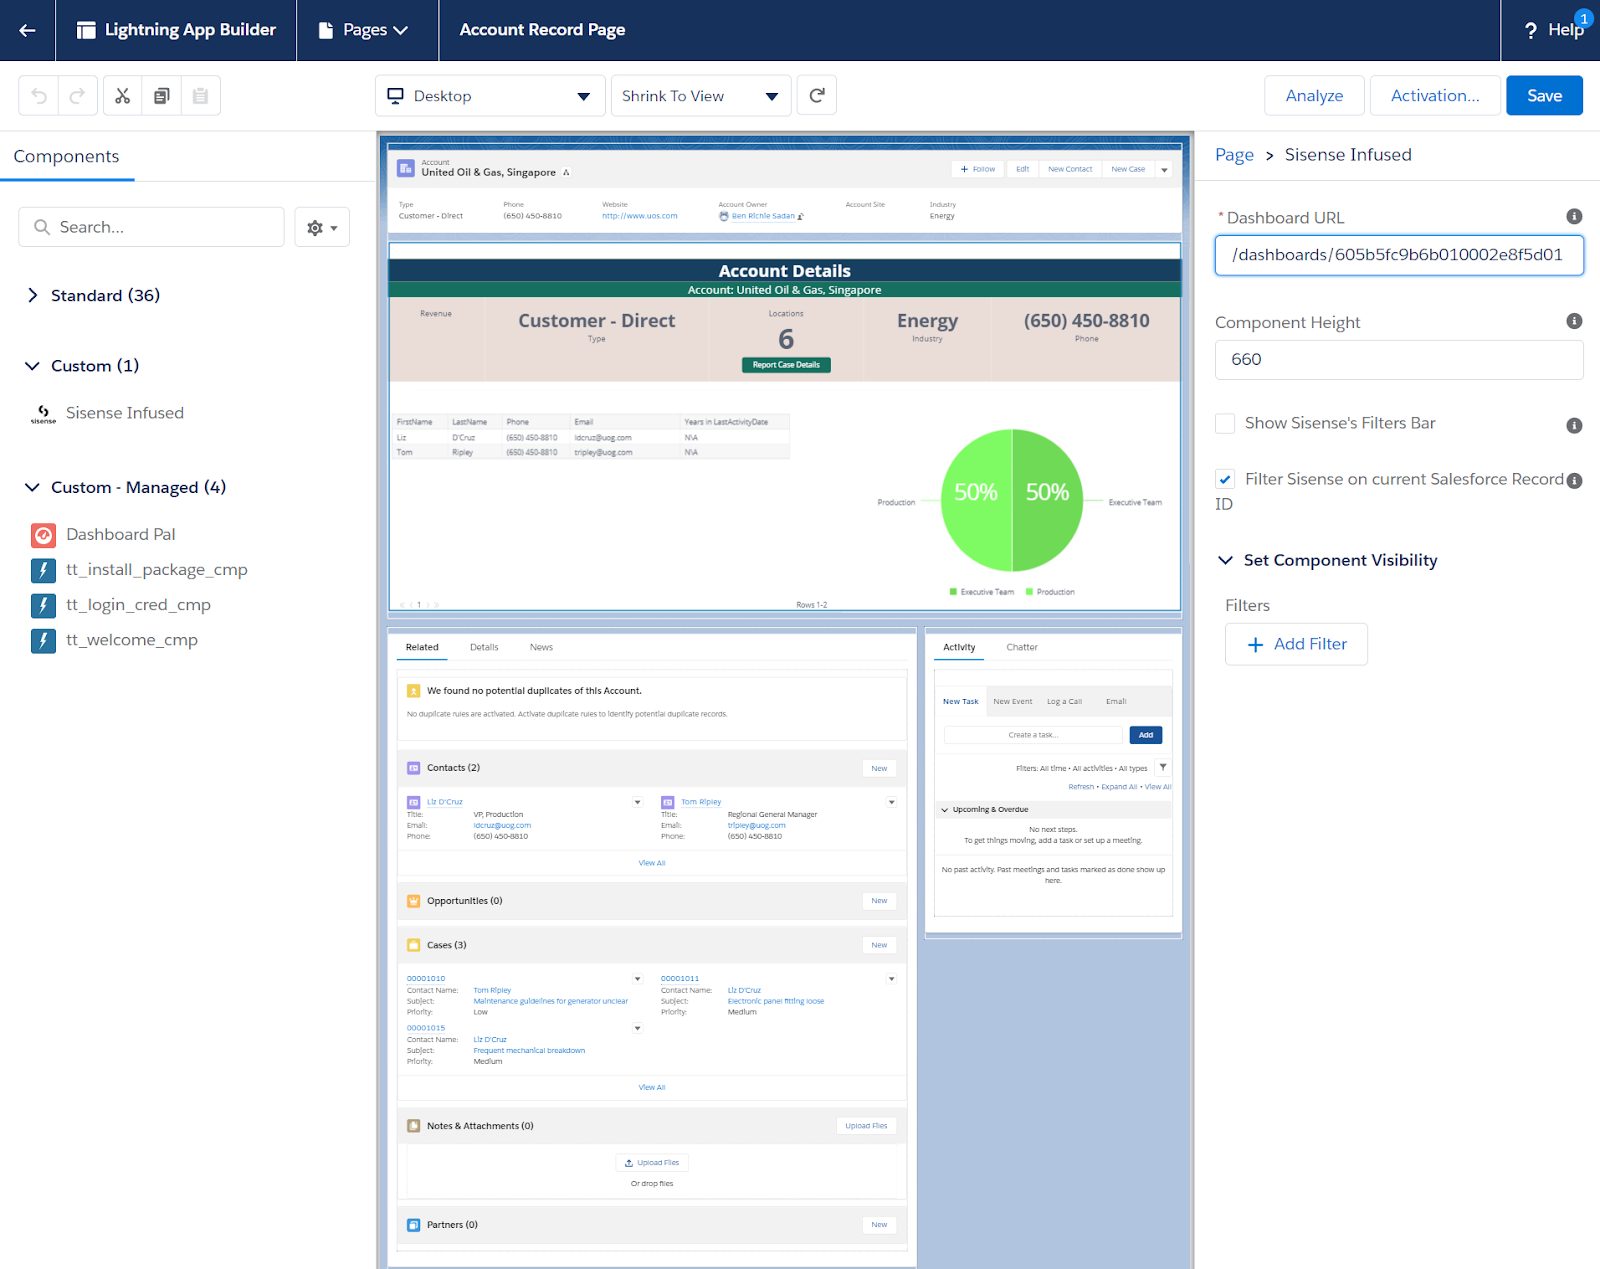 Figure 54: Sisense Analytics
19. Tableau
![]() The most well-known products in the area of BI & Analytics of the company Tableau are Tableau Server, Tableau Desktop, Tableau Online, Tableau Public, and Tableau Cloud. We analyzed and evaluated these BI & Analytics products in depth and meticulously. The Business Intelligence tools from Tableau can be characterized by good support on the following topics:
The most well-known products in the area of BI & Analytics of the company Tableau are Tableau Server, Tableau Desktop, Tableau Online, Tableau Public, and Tableau Cloud. We analyzed and evaluated these BI & Analytics products in depth and meticulously. The Business Intelligence tools from Tableau can be characterized by good support on the following topics:
- analytics
- data management
- analysis
- embedded analytics
- business intelligence
- dashboards
- advanced analytics
- Python
- predictive analytics
- Salesforce
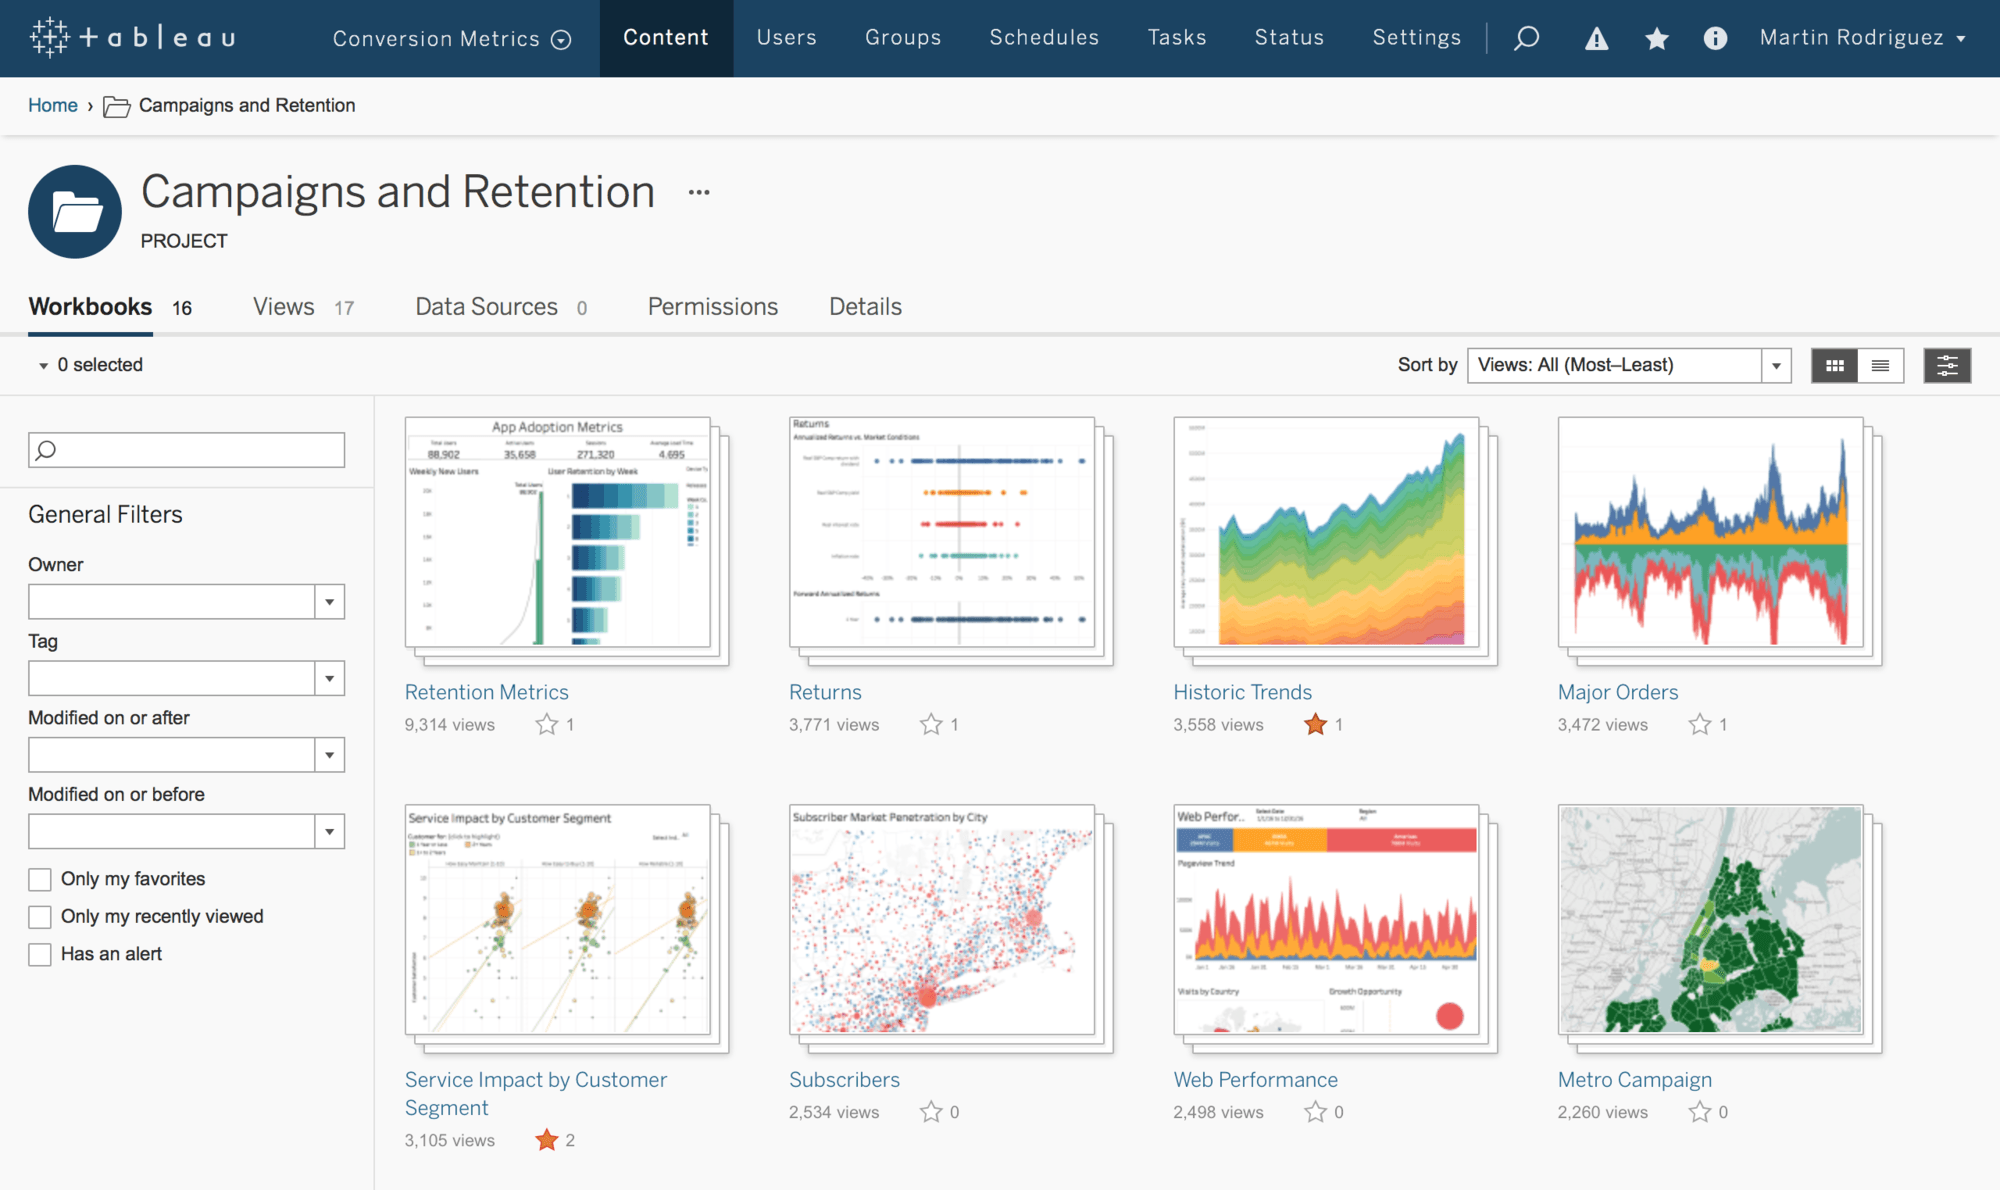 Figure 55: Tableau Server
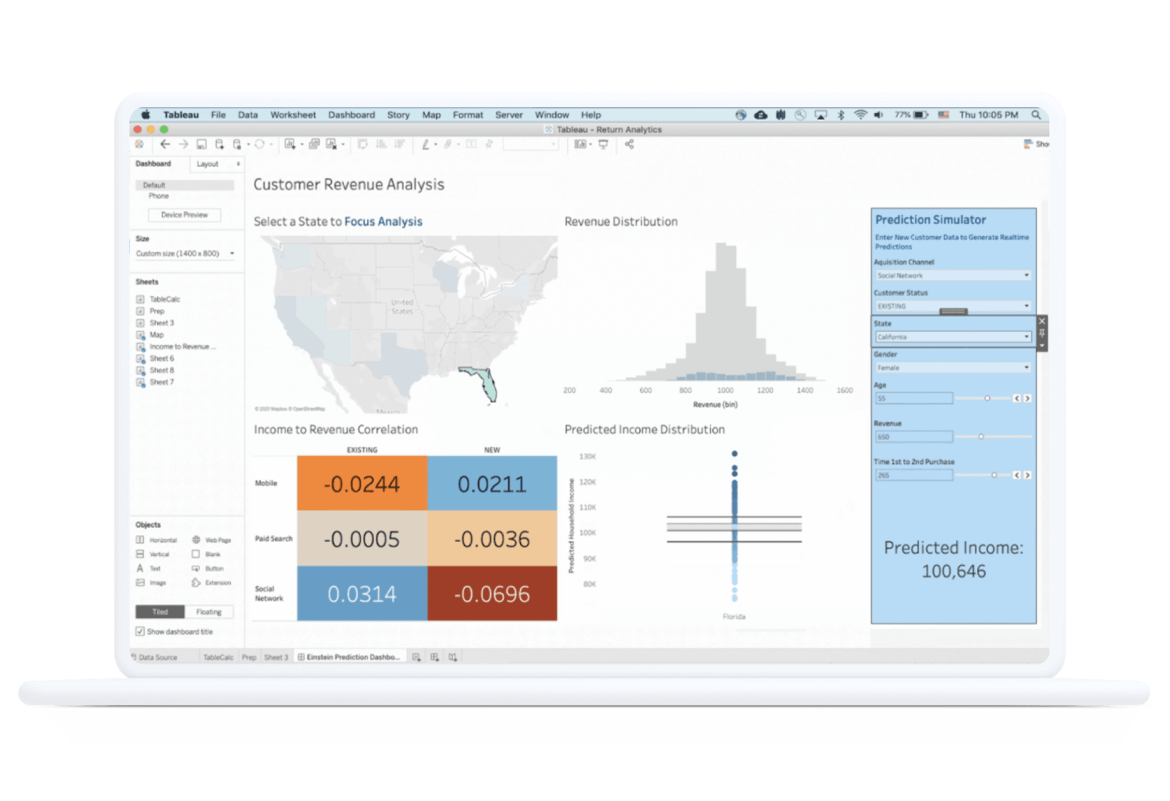 Figure 56: Tableau Desktop
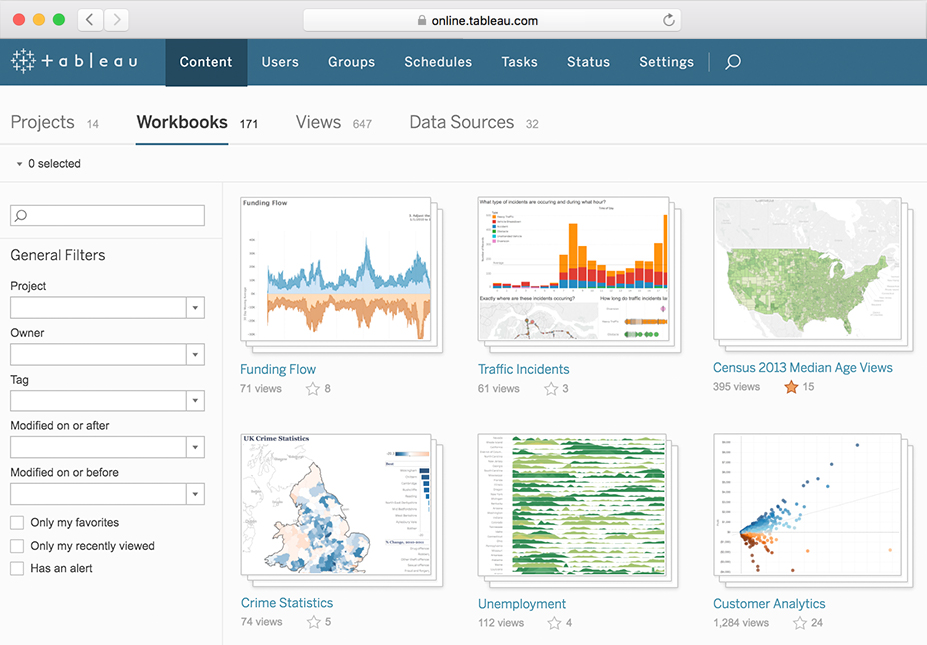 Figure 57: Tableau Online
20. ThoughtSpot
 ThoughtSpot is widely known for its products SpotIQ, ThoughtSpot Embrace, ThoughtSpot mobile, ThoughtSpot DataFlow, and ThoughtSpot Business Intelligence. The company is 100% specialized in BI & Analytics. Take a look at the images below. The Business Intelligence tools from ThoughtSpot are strong in the following areas, among others:
- analysis
- business intelligence
- analytics platform
- Teradata
- in-memory
- Android
- iOS
- share insights
- natural language
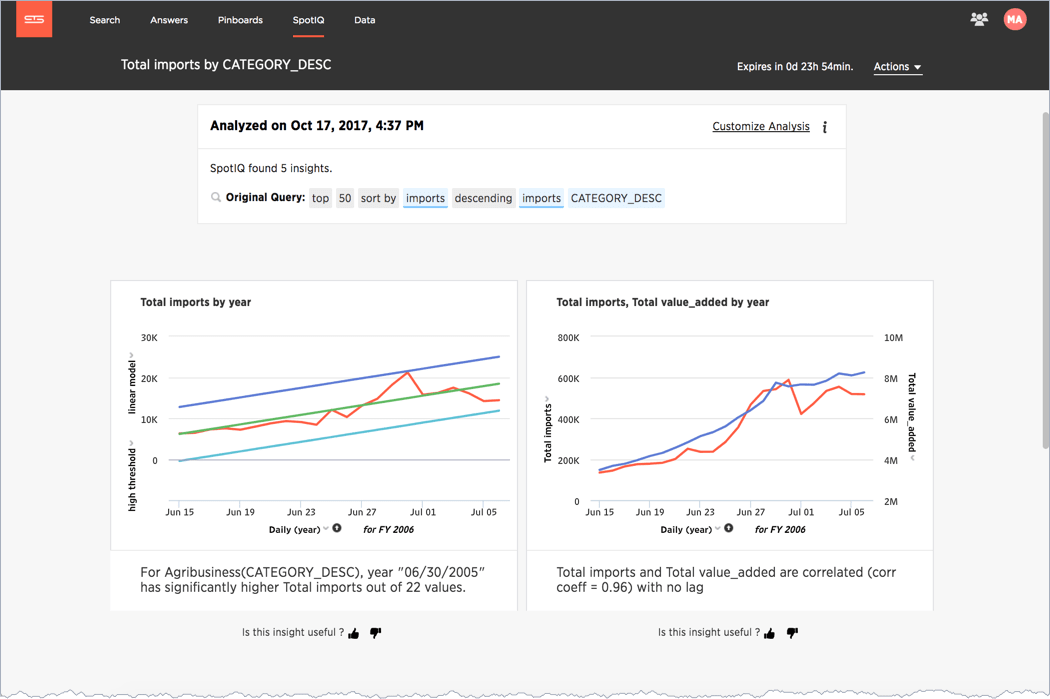 Figure 58: SpotIQ
 Figure 59: ThoughtSpot Embrace
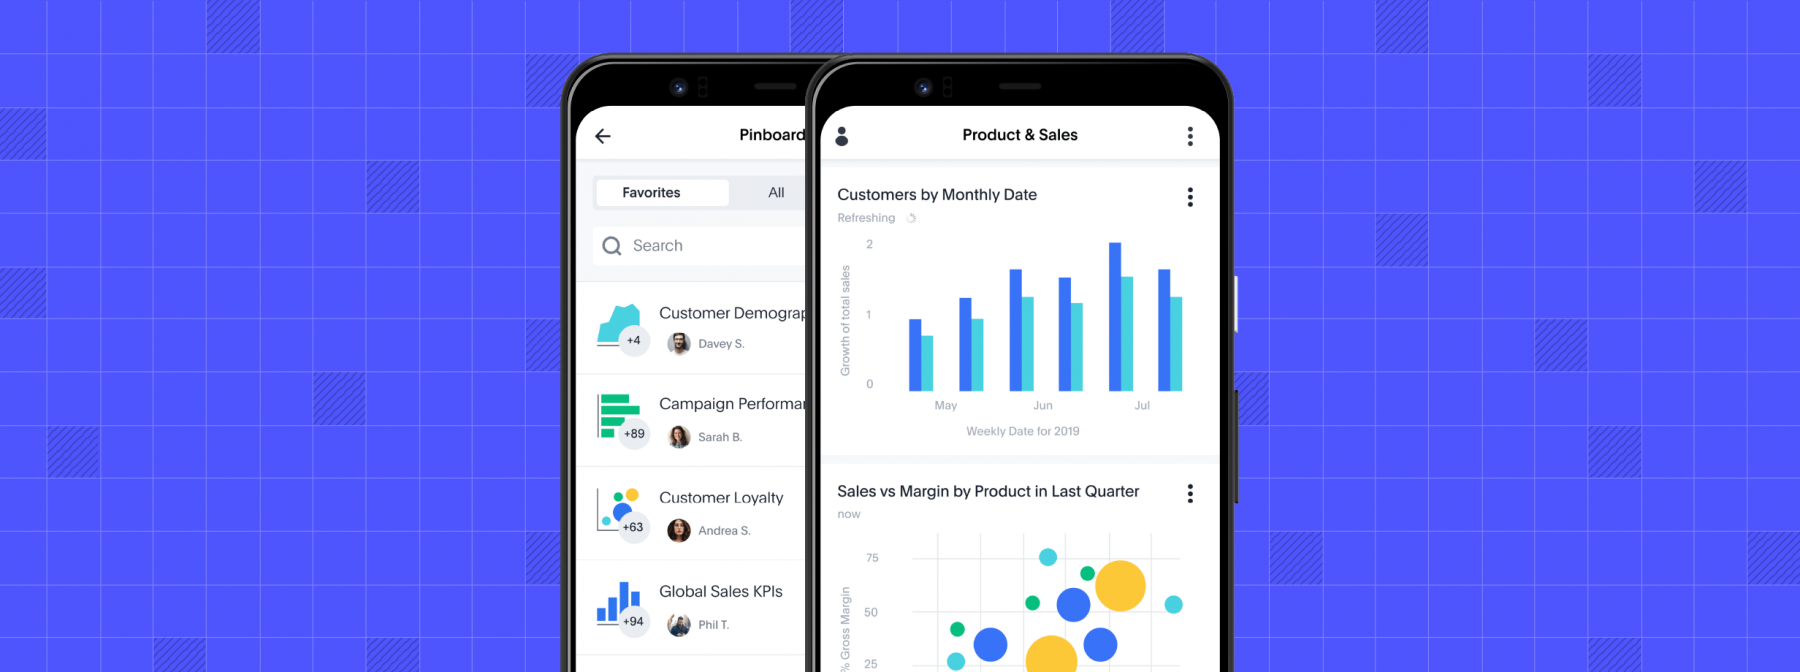 Figure 60: ThoughtSpot mobile
21. TIBCO
![]() TIBCO is widely known for its products TIBCO Spotfire, TIBCO Data Science, TIBCO Data Virtualization, Jasperreports, and TIBCO Analytics. The company is 100% specialized in BI & Analytics. Take a look at the images below. The Business Intelligence tools from TIBCO are strong in the following areas, among others:
TIBCO is widely known for its products TIBCO Spotfire, TIBCO Data Science, TIBCO Data Virtualization, Jasperreports, and TIBCO Analytics. The company is 100% specialized in BI & Analytics. Take a look at the images below. The Business Intelligence tools from TIBCO are strong in the following areas, among others:
- analytics
- real-time
- data science
- streaming
- MDM
- data quality
- data virtualization
- data catalog
- reporting
- analysis
 Figure 61: TIBCO Spotfire
 Figure 62: TIBCO Data Science
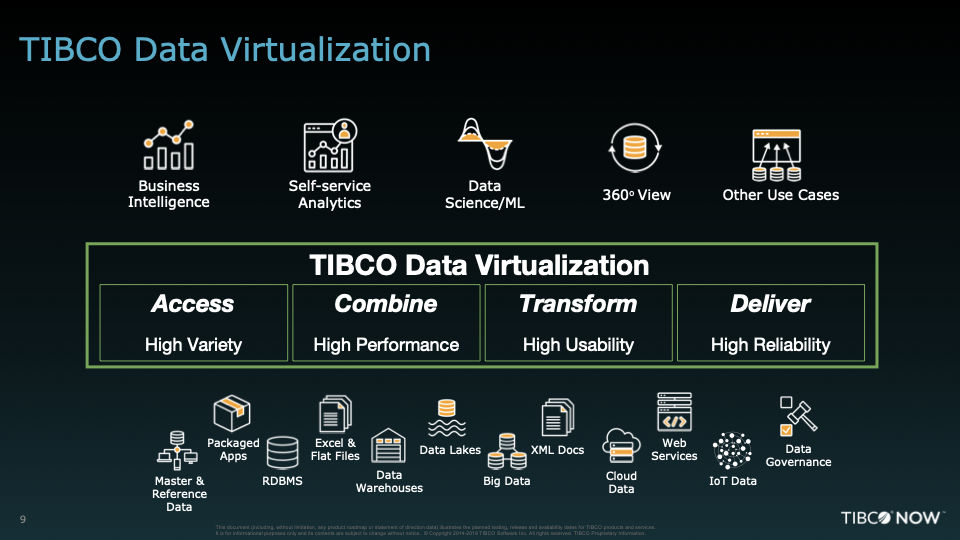 Figure 63: TIBCO Data Virtualization
22. Wyn Enterprise
![]() As far as we have been able to ascertain, Wyn Enterprise currently has only one primary product: Wyn Enterprise Business Intelligence. Take a look at the screen shots below. The Business Intelligence tools from Wyn Enterprise are strong in the following areas, among others:
As far as we have been able to ascertain, Wyn Enterprise currently has only one primary product: Wyn Enterprise Business Intelligence. Take a look at the screen shots below. The Business Intelligence tools from Wyn Enterprise are strong in the following areas, among others:
- dashboards
- enterprise business intelligence
- analytics
- reporting
- embedded business intelligence
- interactive dashboards
- analysis
- self-service BI
- business intelligence platform
 Figure 64: Wyn Enterprise Business Intelligence
 Figure 65: Wyn Enterprise Business Intelligence
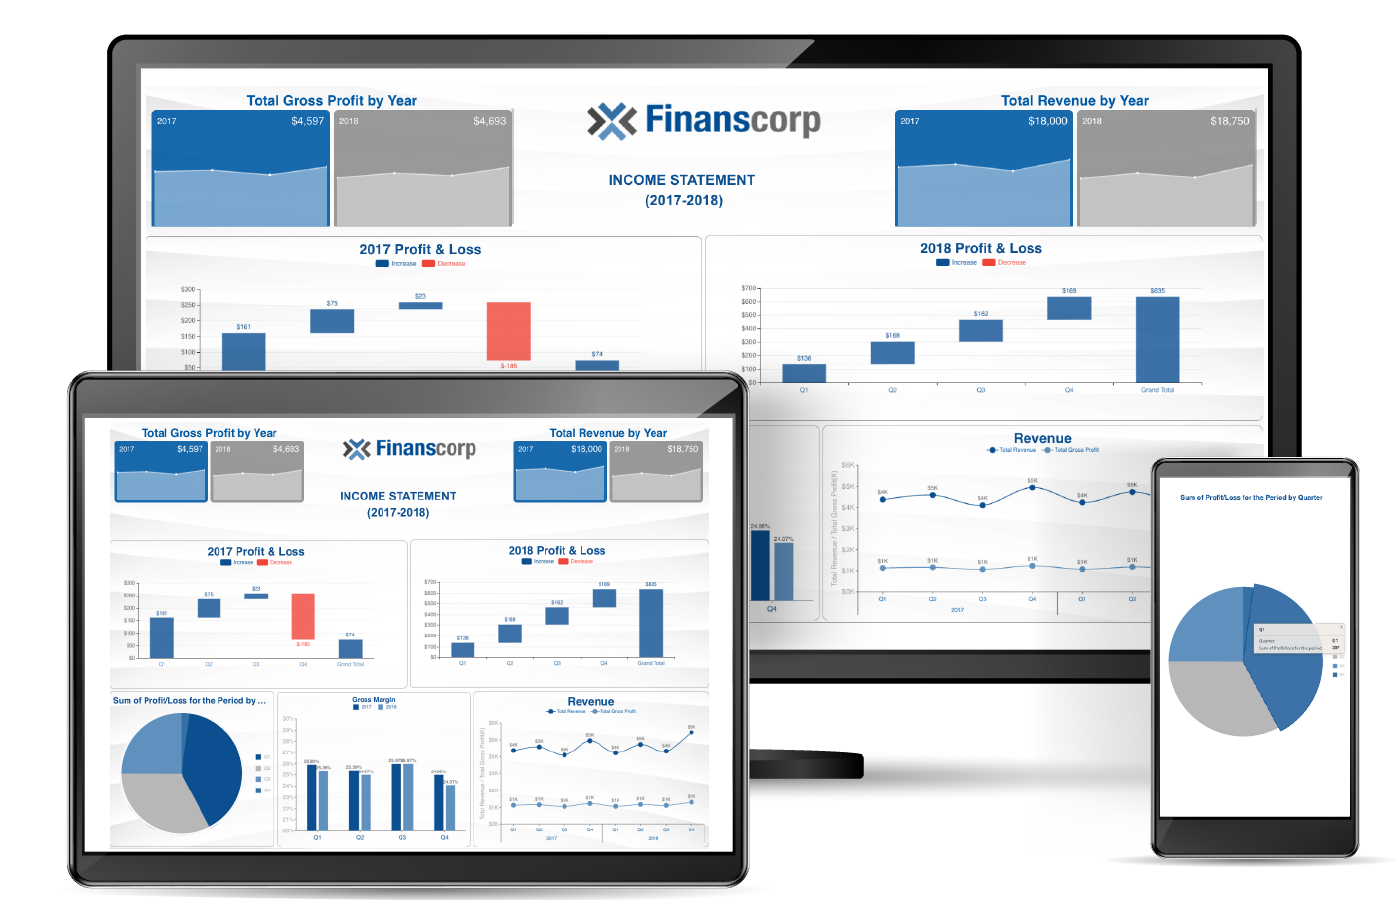 Figure 66: Wyn Enterprise Business Intelligence
23. Yellowfin
![]() The most well-known products in the area of BI & Analytics of the company Yellowfin are Yellowfin Signals, Yellowfin Suite, Yellowfin Dashboards, Yellowfin SAML Bridge, and Yellowfin Data Discovery. We analyzed and evaluated these BI & Analytics products in depth and meticulously. The Business Intelligence tools from Yellowfin can be characterized by good support on the following topics:
The most well-known products in the area of BI & Analytics of the company Yellowfin are Yellowfin Signals, Yellowfin Suite, Yellowfin Dashboards, Yellowfin SAML Bridge, and Yellowfin Data Discovery. We analyzed and evaluated these BI & Analytics products in depth and meticulously. The Business Intelligence tools from Yellowfin can be characterized by good support on the following topics:
- dashboards
- business intelligence
- analysis
- reporting
- data discovery
- data preparation
- analytics platform
- data science
- data storytelling
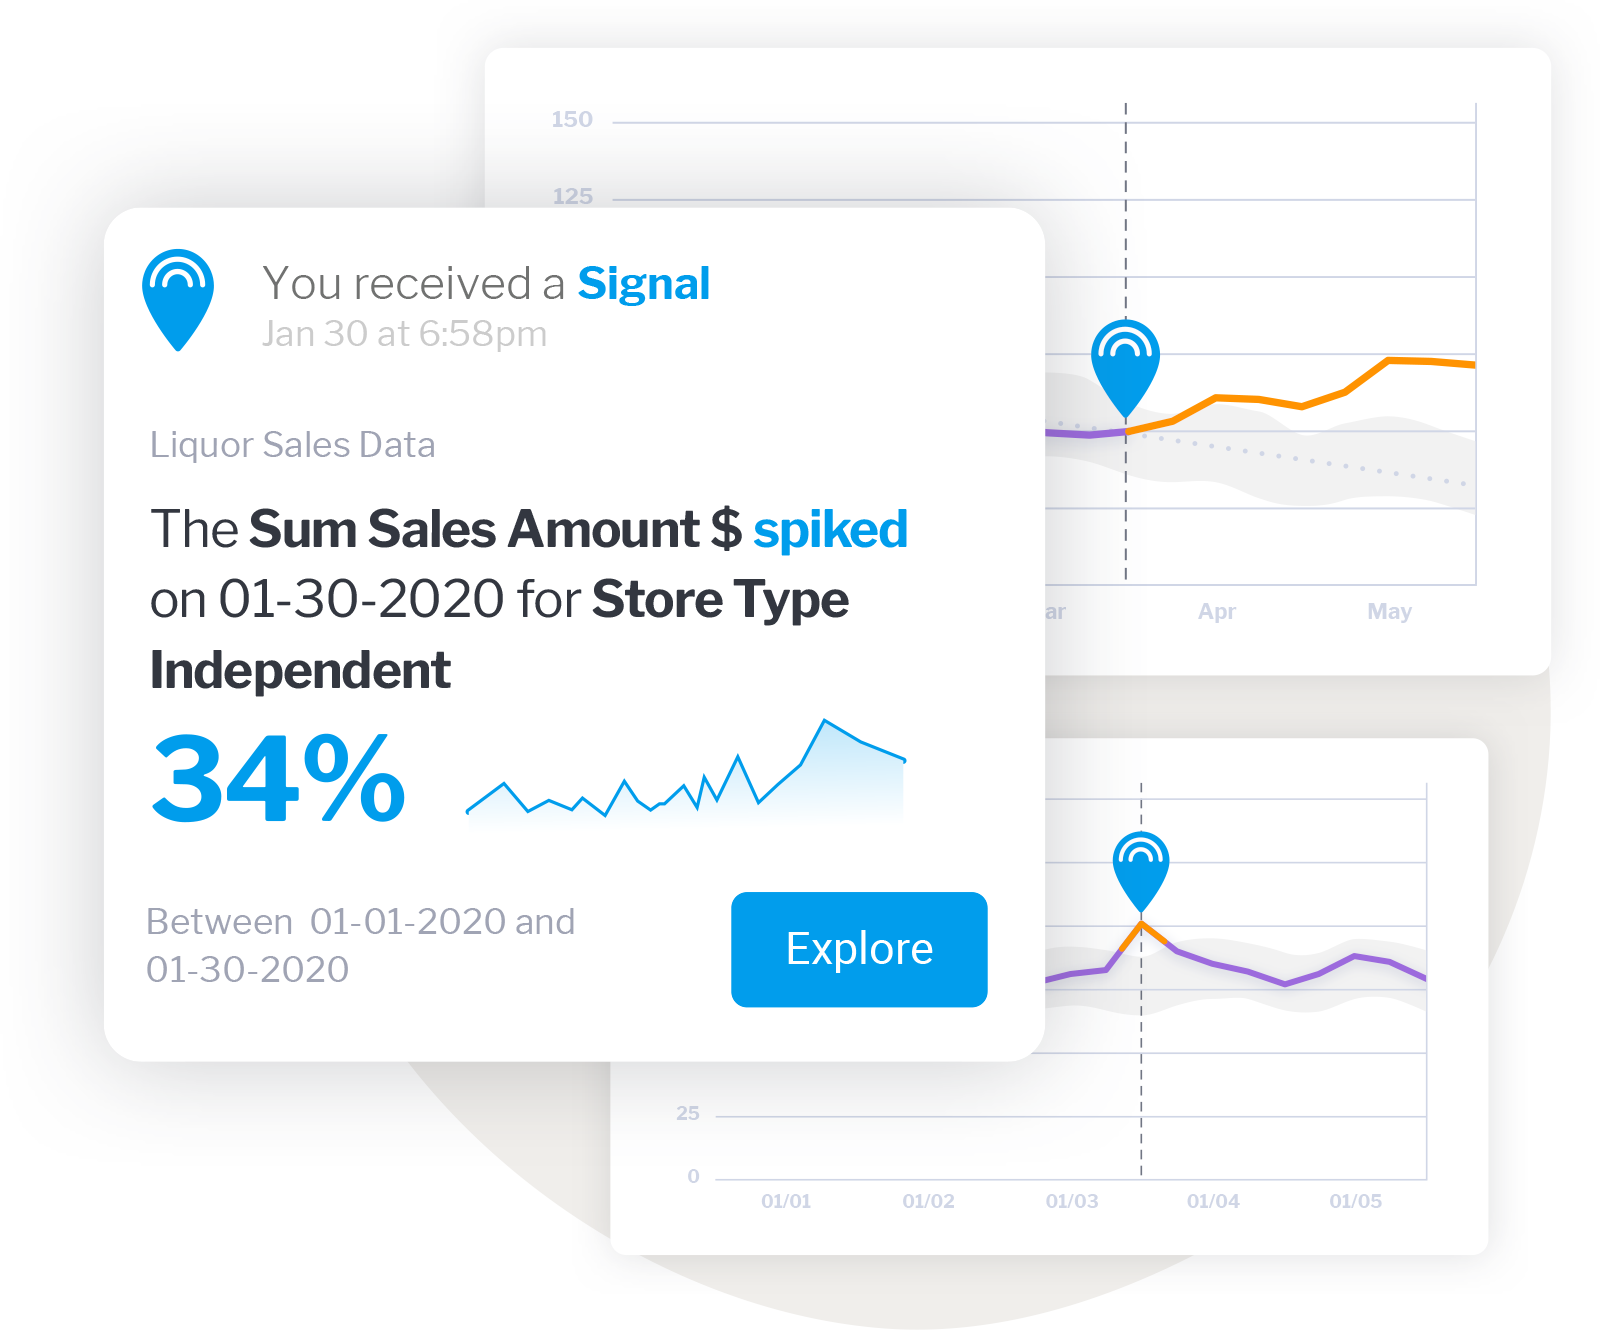 Figure 67: Yellowfin Signals
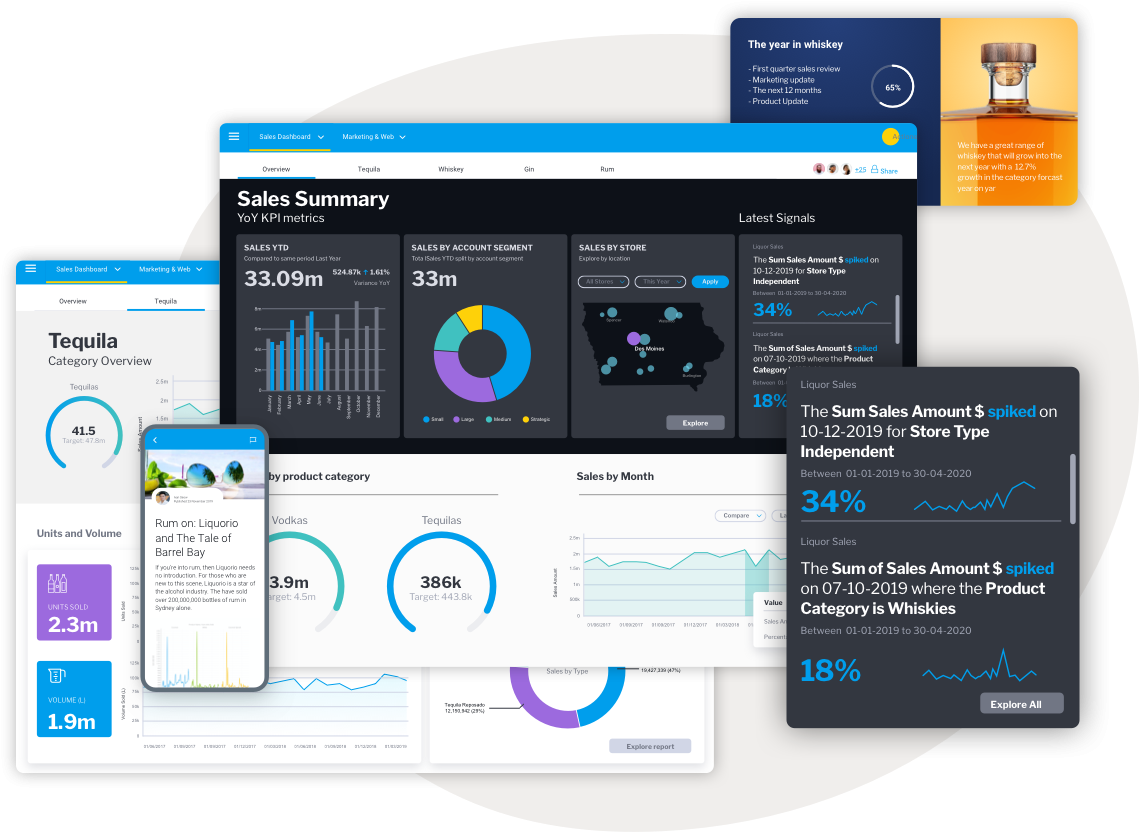 Figure 68: Yellowfin Suite
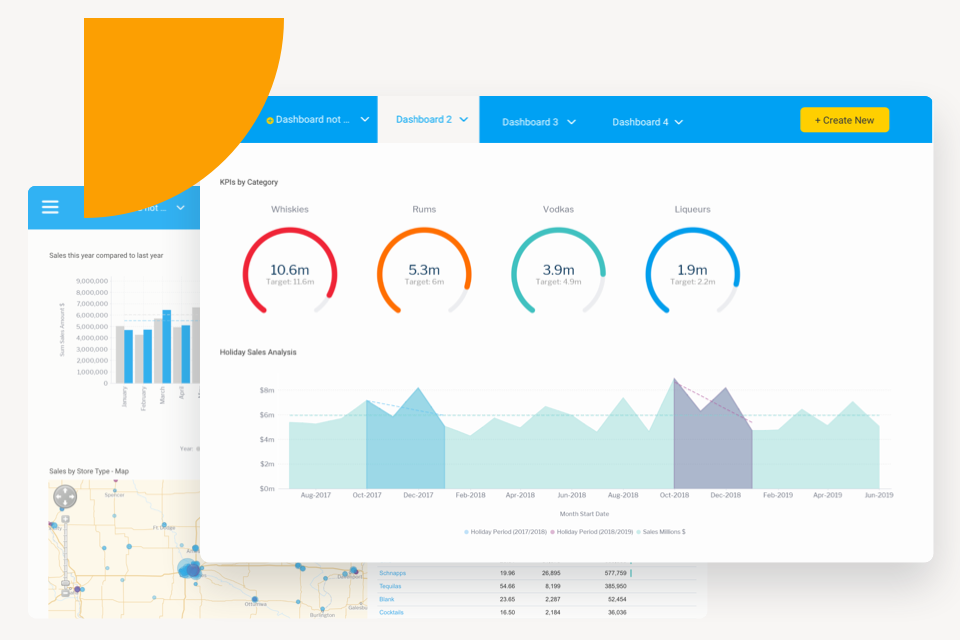 Figure 69: Yellowfin Dashboards
24. Zoho BI & Analytics
![]() The most well-known products in the area of BI & Analytics of the company Zoho are Zia, Zoho Databridge, Zoho DataPrep, and Zoho Analytics Server. We analyzed and evaluated these BI & Analytics products in depth and meticulously. The Business Intelligence tools from Zoho can be characterized by good support on the following topics:
The most well-known products in the area of BI & Analytics of the company Zoho are Zia, Zoho Databridge, Zoho DataPrep, and Zoho Analytics Server. We analyzed and evaluated these BI & Analytics products in depth and meticulously. The Business Intelligence tools from Zoho can be characterized by good support on the following topics:
- analytics
- dashboards
- data preparation
- CRM
- Windows
- SQL
- business intelligence
- self-service BI
- mobile business intelligence
- self-service data preparation
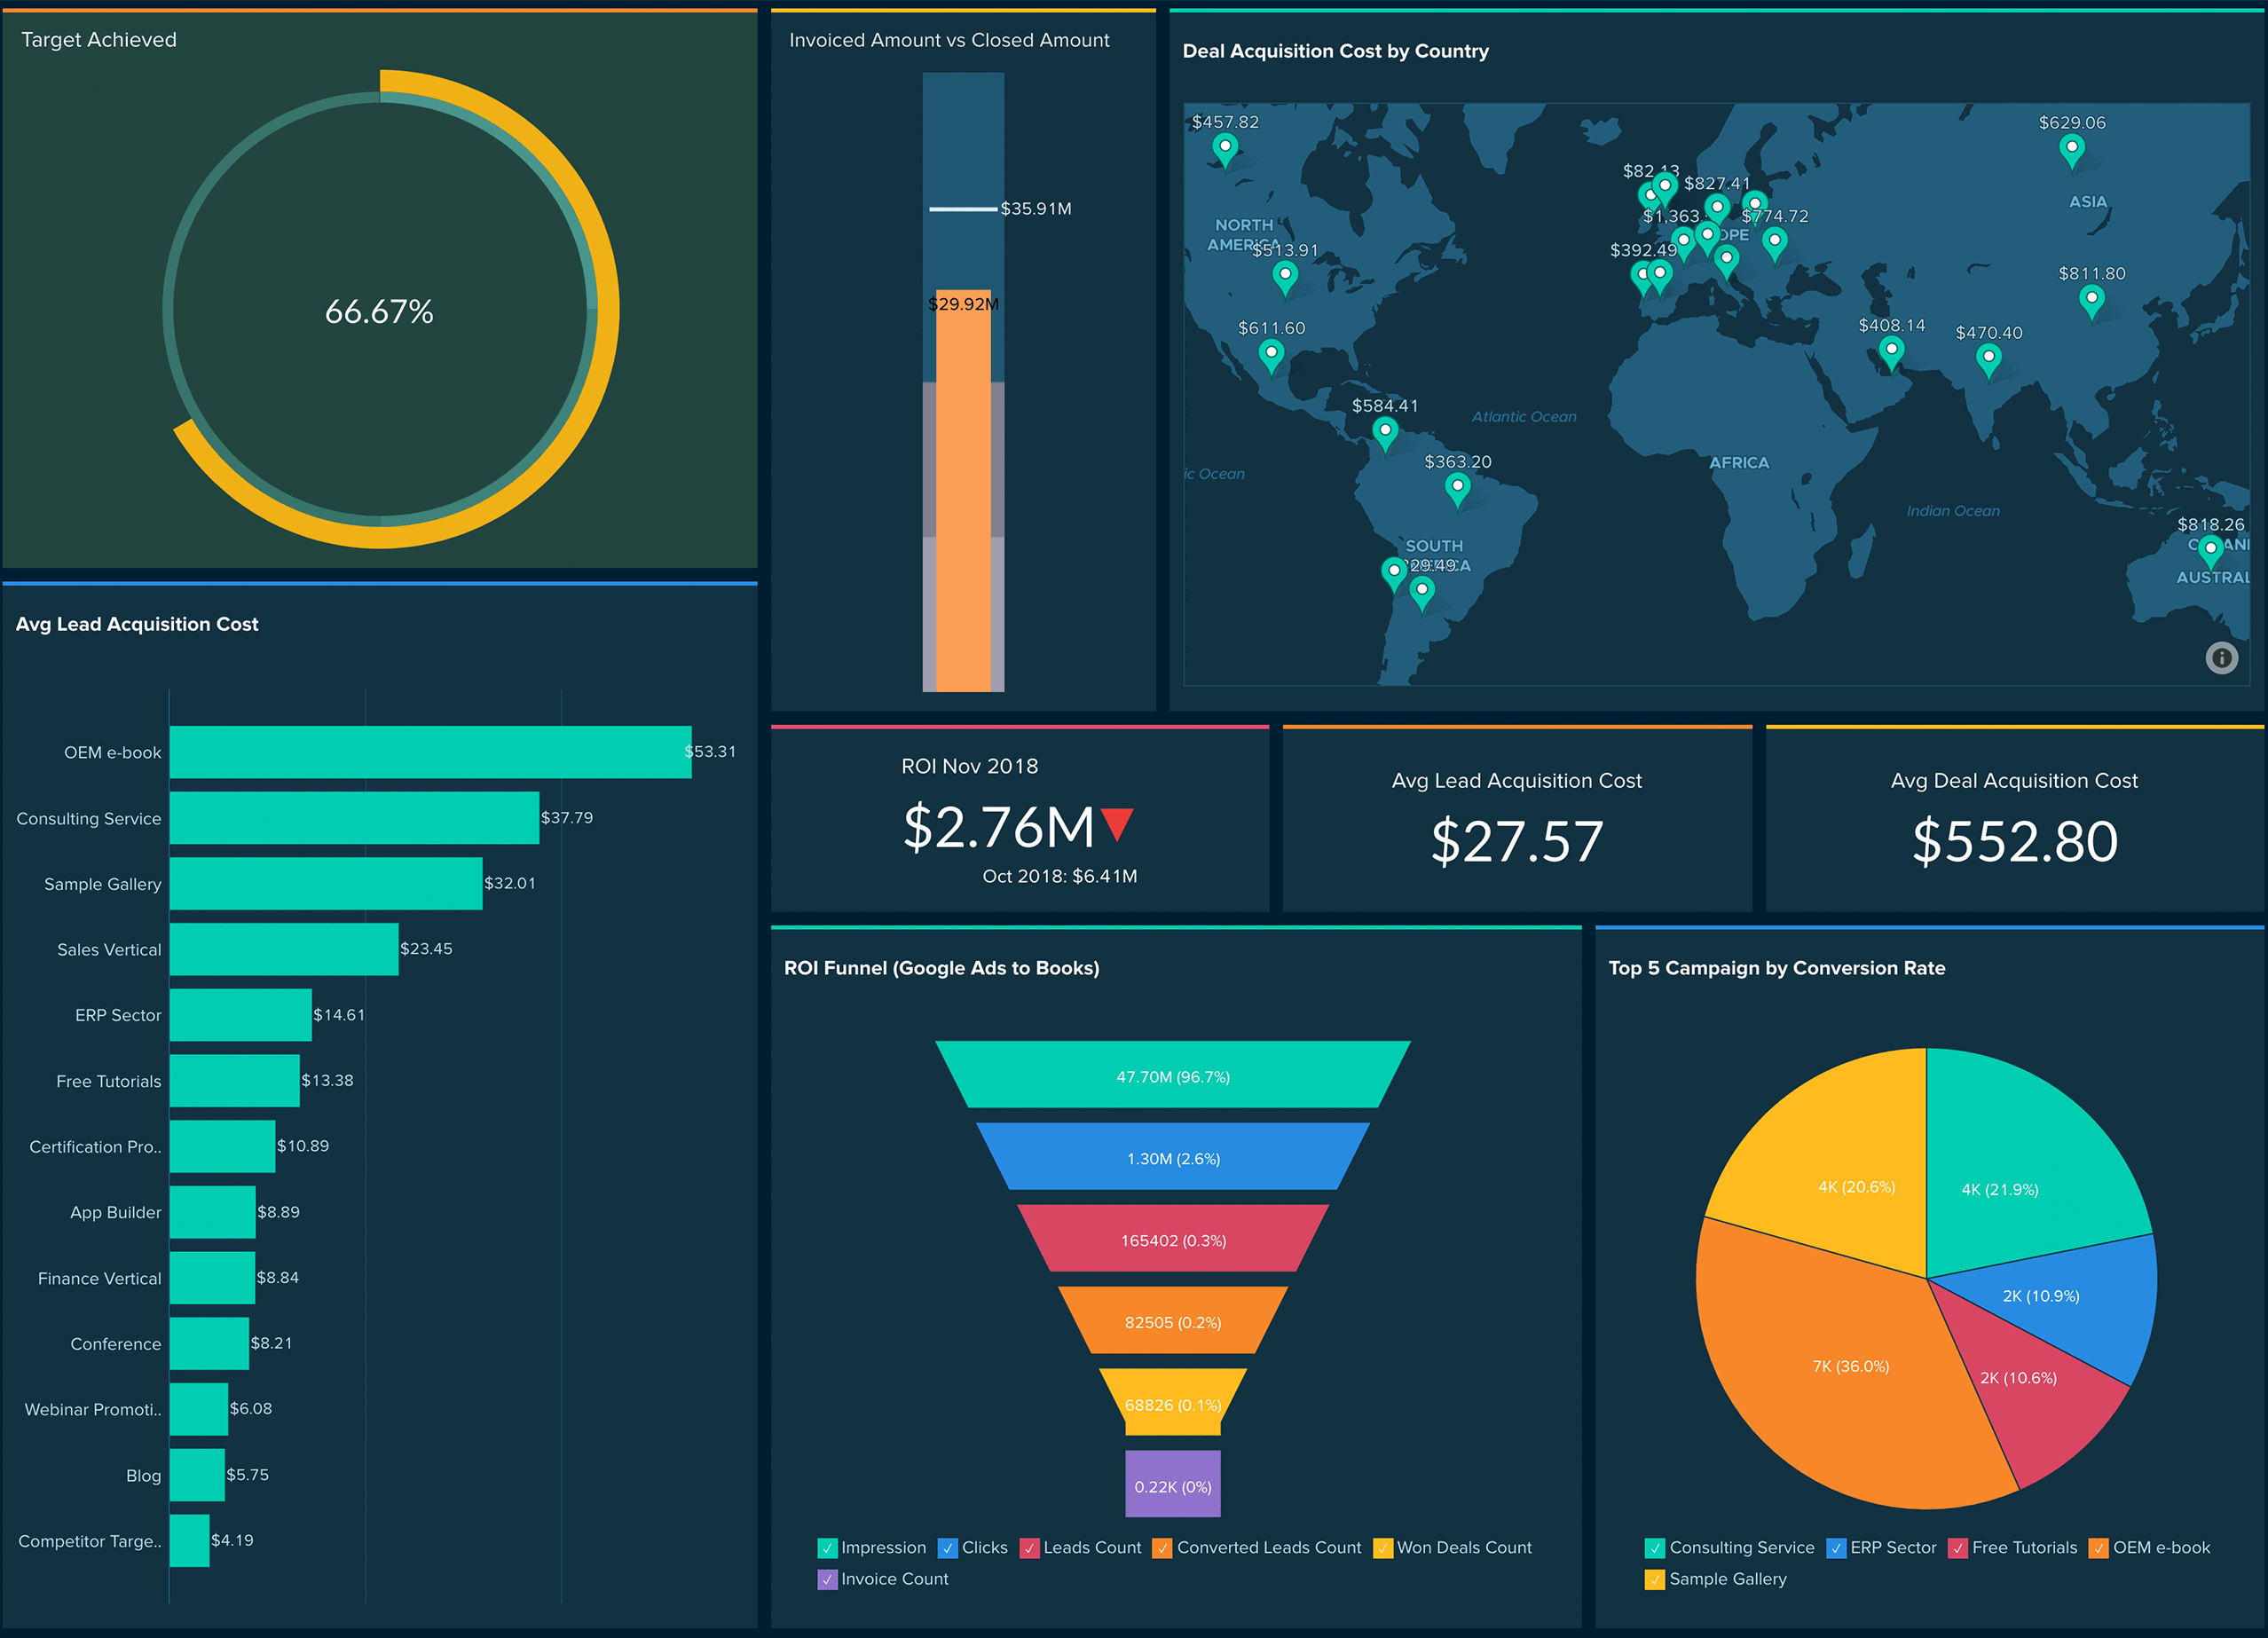 Figure 70: Zoho Analytics
 Figure 71: Zia
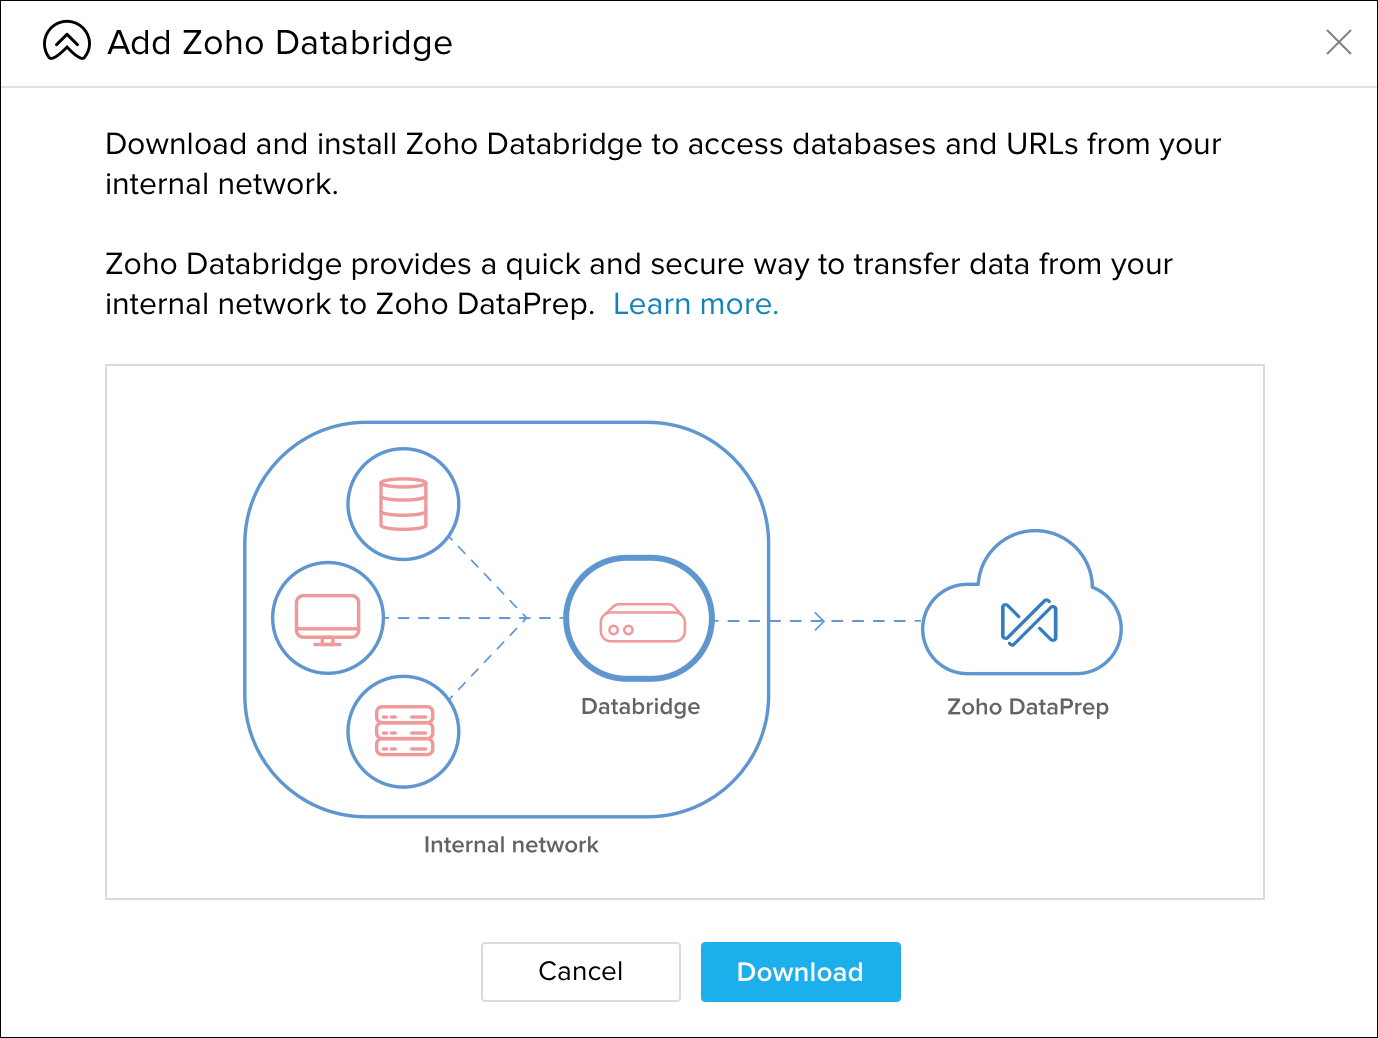 Figure 72: Zoho Databridge
How can BI tools help an organization?
Business Intelligence tools equip organizations with reliable management information and advanced insights to enhance decision-making and collaboration. With BI tools, you can generate detailed reports, perform in-depth analyses, and visualize key performance indicators (KPIs) through intuitive dashboards, ensuring data-driven success.
The BI & Analytics Guide™ 2026 If you need help choosing the right BI or data science tool for you, the BI & Analytics Guide can help you to quickly arrive at a shortlist and make a final selection. Our BI & Analytics Guide gives you many comparison functionalities. See which vendor excels in which area and compare vendors in just a few clicks.
Excel: the most misused BI tool
Choosing the wrong BI tool can significantly impact your organization. Many companies struggle with inefficient information infrastructure, preventing them from effectively extracting the management information they need. Excel is a prime example of this issue – it is widely used for Business Intelligence but often falls short, earning its reputation as the most misused BI tool. While Excel is powerful for spreadsheets, it lacks the scalability, automation, and advanced analytics capabilities required for true BI success.
How to choose the best BI tool?
Some people download a popular BI tool without much thought and start using it enthusiastically. That’s great – until they realize later that key functionalities are missing, costs rise with more users, or the tool isn’t as simple as promised. That’s why making an informed choice is essential. Here are the five most important steps to selecting the right Business Intelligence software:
- Define the most important BI tool selection criteria: IT needs and user requirements
- With this list, contact vendors for answers (RFI)
- Analyze all the data from the different Business Intelligence vendors
- Shortlist up to 3 vendors and BI tools that score best
- Start a “proof of concept” and choose the solution that best fits your requirements
Of course, you can use tools like ChatGPT for assistance, but their accuracy and reliability can sometimes be questionable, making it unclear which information to trust. However, you can skip steps 1 through 4 entirely by downloading our independent BI tool comparison guide. We’ve handled the time-consuming research for you, saving valuable time and ensuring that the information is correct.
Let us help you with your BI tool selection
Selecting the right BI software is a time-consuming process – we know this from experience. For over 20 years, we have been guiding organizations through this journey with our expertise, supported by our powerful assessment tool, the Business Intelligence & Analytics Guide, and our independent BI consulting services.
The 250+ functionalities of Business Intelligence software
Business Intelligence tools come in many forms, each with its own strengths. Some excel in reporting, while others are designed for dashboarding. Some are platform-specific, running only on Windows. In our BI vendor survey, we compare all these tools across 250+ criteria that are critical for achieving the best results with business analytics – so you don’t have to conduct this research yourself.
Need help choosing the right Business Intelligence tool?
If you need assistance selecting the best BI tool for your business, feel free to contact us for more information or to schedule an appointment.
About Passionned Group
![]() Passionned Group is the specialist in designing and implementing Business Intelligence tools and Data Science. Our passionate BI consultants help large and small organizations transform into an intelligent organization. Every other year we organize the Dutch BI & Data Science Award©, the election of the smartest organization in the Netherlands.
Passionned Group is the specialist in designing and implementing Business Intelligence tools and Data Science. Our passionate BI consultants help large and small organizations transform into an intelligent organization. Every other year we organize the Dutch BI & Data Science Award©, the election of the smartest organization in the Netherlands.