From still water to a churning river
Data-driven work is what’s happening. Every organization wants it or has it embedded in its strategy. The will is there and that is, of course, good news. But then many organizations build a paltry peep box (a children’s craft that involves making a diorama inside a box with a hole to look at it) that pretty much only facilitates looking backwards. They may create super-cool dashboards and hammer together a data warehouse by the book, but they continue to struggle with data-driven work. After all, that term assumes that the actions of everyone in the organization are guided by data and the insights derived from it. With a peep box, that can hardly be the case. You are looking at stagnant water that also gets cloudy over time. Your vision deteriorates and your canoe just floats around. Decisions are made based on knowledge, experience, opinions, and gut feeling.
Navigating well on the flow of change
To achieve success with data-driven work (Business Intelligence & Analytics), you need to know how to build a dazzling decision box. Only then will you really get a good view of the churning river that reflects your organization’s operations. With a decision box on board, you can steer your boat well, and anticipate the flow of change. This is an art and it requires management, courage, and leadership. In this article, we explore the process of moving from a paltry peep box to a dazzling decision box and provide 7 valuable real-world tips.
The paltry peep box, accountability, and KPIs
Peep boxes have no relationship to the management of the organization and how to achieve better performance together. So what do we mean by peep box here?
A peep box is a dashboard or report (or a collection of them) that acts as a rearview mirror that you use primarily to provide accountability.
Looking backward can be fun but it’s also terribly boring and shortsighted. It is like still water. It provides virtually nothing besides information for accountability. Accountability is, unfortunately, the tenor (or terror) in many sectors, fueled in part by all sorts of laws and regulations. If you look too much or only in the rearview mirror, you don’t see what is happening now and what is coming your way. Dangerous driving, shall we say. So we look into the rearview mirror but we can’t do much else with what we see in it. We stare blindly.
Get rid of the worn-out KPIs
A peep box wouldn’t have been a big deal if it contained real KPIs. And not the worn-out KPIs that everyone talks about such as customer satisfaction, production, turnover, absenteeism, and so on. But often you see peep boxes filled to the brim with meaningless, far too general information. A very expensive report factory.The output is monitored but what happens in front of it is not modeled and therefore remains invisible. And precisely what is in front of it is crucial. A peep box focusing on the real KPIs could still serve as a kind of alarm center. You are alerted to poor performance and the scores on those KPIs prompt action. Real KPIs are at the heart of your primary process and by definition are not financial. Read more about all the characteristics of genuine KPIs here or open our 2026 SMART KPI Guide.
Four maturity levels for losers and winners
By the way, we at Passionned Group see data-driven working, Data Science, and Business Intelligence as terms you can use interchangeably. In essence, they mean the same thing. But if you want to sow confusion in your organization, make these completely different worlds. In any case, the harvest will not be too good. Anyway, peep boxes are created primarily at maturity level 1: getting an understanding of the organization. In the image below you will find all the maturity levels of Business Intelligence.
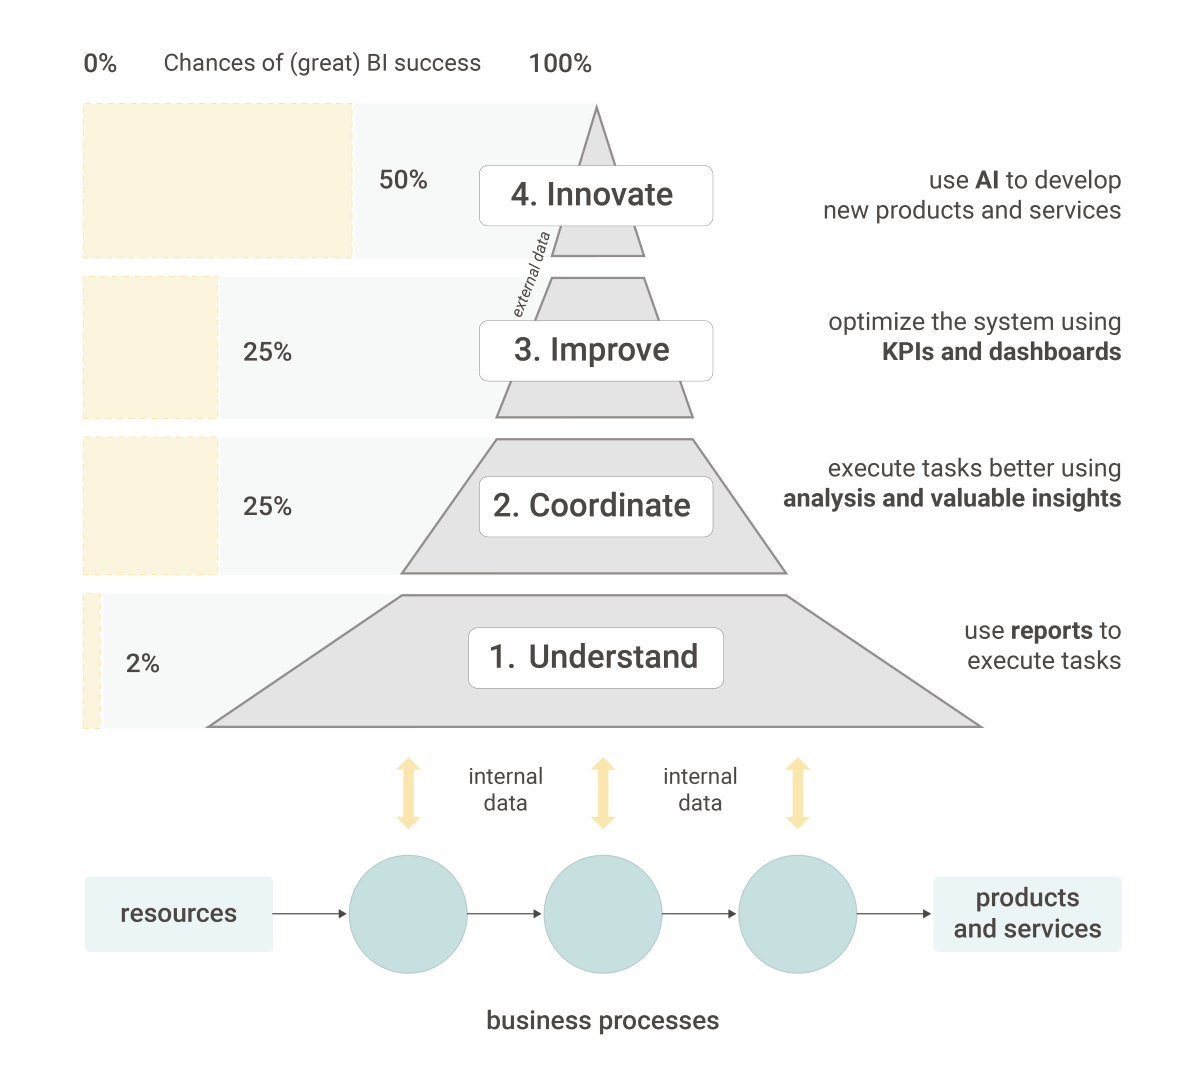 Figure 1: The maturity levels of Business Intelligence & data-driven work depicted as a pyramid. The higher you climb on the pyramid, the more likely you are to achieve success with BI and expect ROI.
The bottom of the pyramid is incredibly crowded. There is absolutely no shortage of peep boxes with dashboards, data warehouses, and report factories. One level up, you start using BI purposefully to better align decisions. Particularly across teams, departments, and domains. For example, the marketing manager starts a new campaign and doubles the advertising budget for a specific item. The production department increases production capacity at the start of the campaign and makes sure they can “handle” the demand. Aligning decisions with each other is called coordinating. At the “improve” level, organizations deliberately use data to make better decisions and optimize processes on a daily basis. This is particularly where you flesh out the decision box. At the highest level, it is remarkably quiet. That’s how it works with a pyramid. Only a handful of organizations manage to reach the top by innovating with data. Think for example of Netflix or Pon, one of the winners of the Dutch BI & Data Science Award.
Actually, you see that level 1 is mainly used for strategic purposes and the (monthly) management of outlines. At level 2 you start using Business Intelligence for tactical decisions (weekly) and at level 3 for continuous improvement of operations (daily). This seems odd because the lowest level of the pyramid and the primary processes are closest together. It is one of the reasons why many organizations get stuck there. At that level, it seems like you’re doing a very good job because you’re making things insightful and understandable, but ultimately a report factory won’t get you to the essence.
The key question here is mainly: ‘How do you escape the lowest level?’ Because if we know that then BI can really start to pay off. To do that, we need to step into the world of tactical and operational decisions. We open up the decision box.
What’s in a decision box?
In a decision box, you are going to sculpt Business Intelligence around the decisions a user needs to make: operational, tactical, or strategic. Hence “sculpt” because if you sculpt it, it becomes a work of art. You will find below a handy schema to help you shape a decision box.
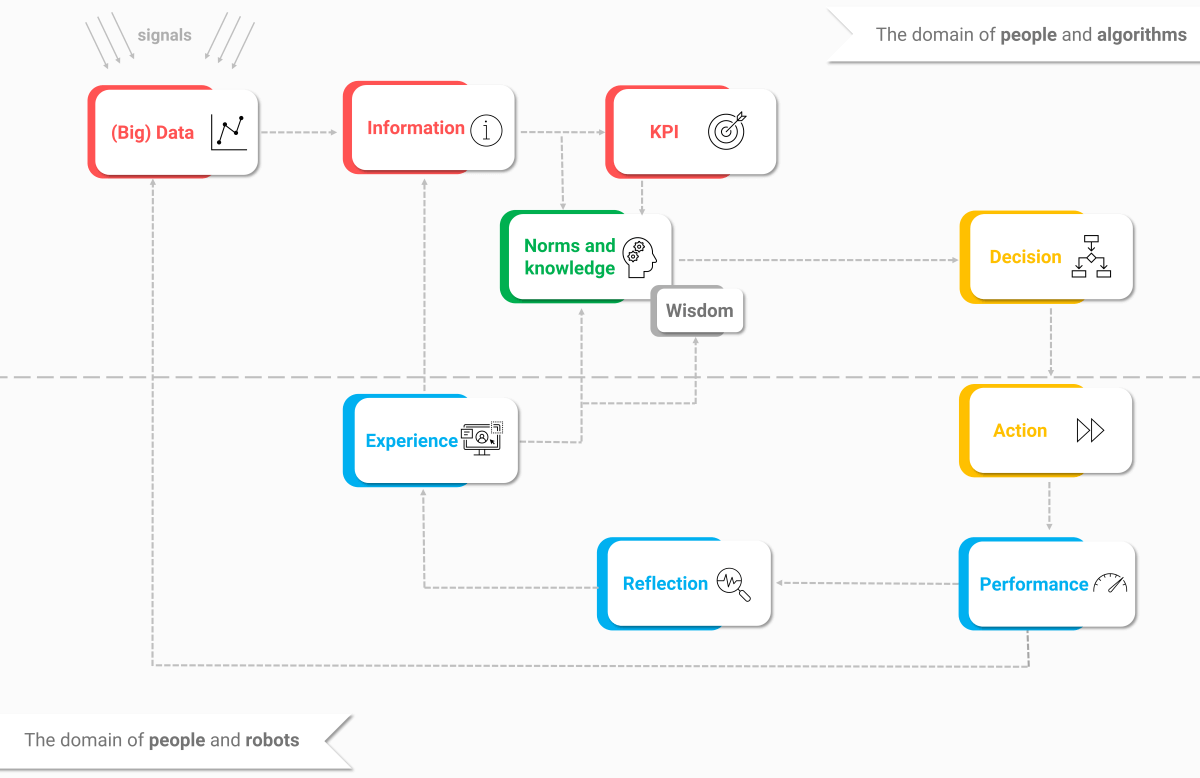 Figure 2: The decision schema focuses on the concrete decision to be made. From there, you reason back to what knowledge, information, and data you need to make the decision but also to improve it along the way.
If you want a complete overview of how Business Intelligence can help your business, continue reading here ‘What is Business Intelligence: the route to success with BI, plus 7 benefits, tips and pitfalls’.
Implementation of the decision box
You build the decision box to make better decisions daily and weekly. Therefore, put a concrete decision at the center. Start with decisions that are being made or should be made in the primary process. Then name the knowledge, data sources, and information needed. With the information and insights at hand, people can make better decisions. Starting from a decision, follow the actions and afterwards, you measure the performance of the decision.
In this particular case, did you make a good decision, yes or no? You should be able to tell that from the real KPIs you show at the performance block. You reflect and analyze daily, weekly, and monthly until you stumble upon new knowledge and insights. That provides a new experience. Validate that knowledge through manual data analysis or AI and when it holds up long enough, you include it in the decision schema and you make that knowledge available as data whenever possible. So you can make the next decision even better and fine-tune the steering of your organization. In this way, you successfully run the PDCA cycle and do not constantly beat around the bush as in a report factory, where the report or dashboard is central and not the decision.
Want more explanation and examples about the decision diagram and decision boxes? Then consult the book “Data Science for Decision Makers & Data Professionals” or download our Bundle of Business Intelligence templates.
Process for the BI team: from decision to insight to data sources
Most BI teams in organizations at the lowest maturity level consist almost exclusively of report builders, data engineers, and dashboard developers. These people also often have a strong “you ask, we turn it in” mentality. Techies are overrepresented. That’s not a bad thing at all, it explains why the data is the focus, with the reports and dashboards the goal, and not the decision. If you are lucky then a (thorough) information analysis will be performed first, “what are you steering toward?” is then a common question. But that won’t help much. Much more knowledge of the business, the processes, and the outside world is needed, because that’s what Business Intelligence is all about. Using the decision diagrams, we put the decisions at the center. Completing those diagrams is a joint effort between the BI team and the decision-makers. Together, they set up the decision diagram. It is then relatively easy for the BI team to define what data sources are needed and how to retrieve that data.
Based on that, it can look at what information (lists, formulas, definitions, links, et cetera) needs to be created that provides fine-grained insight into the situation right now or in the (near) future, in relation to the decision. Keeping in mind that making a decision should become a “piece of cake”. Also, the KPIs for the ‘performance’ block should be calculated and the BI team should also think in advance about the desired analyses at ‘reflection & analysis’. Finally, the BI team pours the information, KPIs, and insights needed for ‘learning to make better decisions’ into a so-called information product. This then consists of a collection of reports, KPI dashboards, and pre-cooked data analyses.
Implementing a top-down approach in BI decision-making
This handling of decision diagrams takes some getting used to for a typical BI team. Because the standard way of working goes upside down: not from data to information to knowledge and action but from decision to insight (knowledge) to information to data. And no more focus on building reports or dashboards immediately, that comes later. The B of BI stands for Business and you put it first by building a decision box. Figure 3 shows that. Begin with the end in mind, a dazzling decision box. Experience shows that you have to train the BI team in the new standard working method, for example by organizing a Business Intelligence training. In addition, you can connect the dots with coaching and guidance.
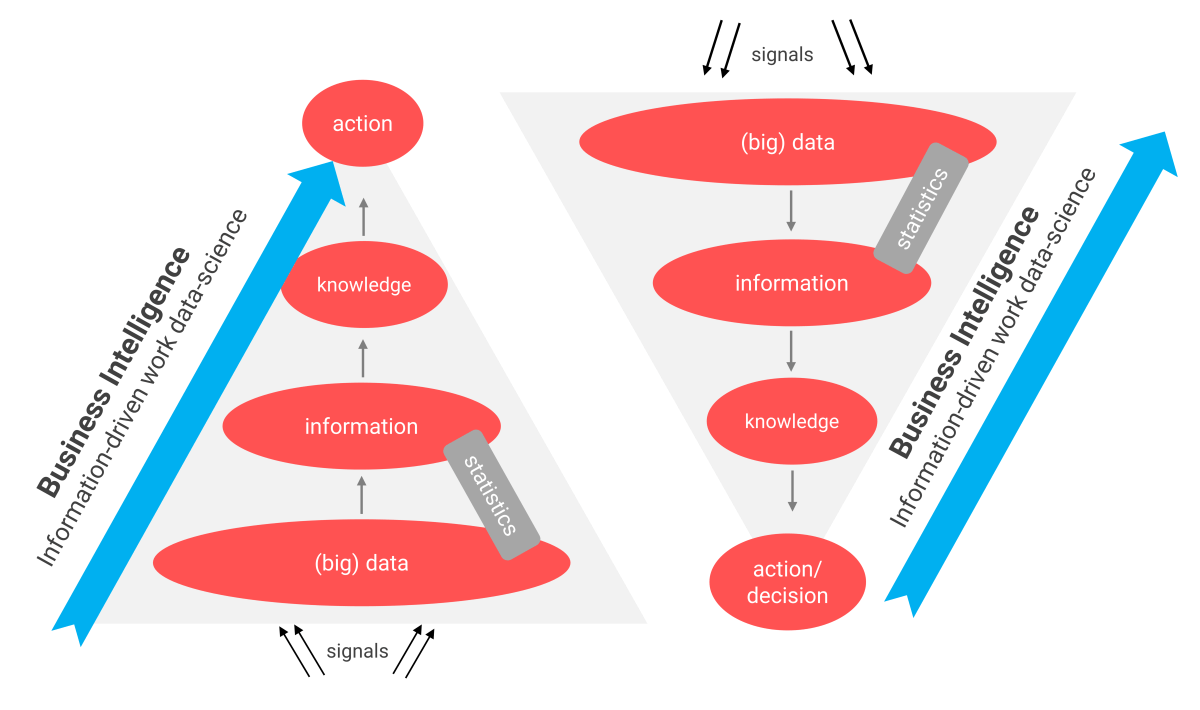 Figure 3: The standard way of working should be exactly the other way around, no longer reasoning from bottom to top but from top to bottom.
But this story is not for everyone. In particular, the data architect and the data engineer may try to put a spoke in the wheel. They may argue that they cannot establish a good data architecture (including star schemas) with the other standard way of working. They may threaten to throw in the towel. Do they have an argument? Sure, if you only work out and implement one decision schema each time, over time you end up with an inextricable tangle of data. An architecture that scares the hell out of you. But there’s a way around that.
Bundle the 10 most important decisions of the organization, model them purely and carefully, and create a detailed decision schema for each decision. Then, based on the cubes of “data,” “information,” “performance,” and “reflection & analysis” from the various decision schemas, the data architect can get to work creating a good, balanced data architecture. Practice shows that by modeling the 10 most important decisions you can achieve sufficient data coverage for a ‘clean’ architecture.
Process for the decision makers: the data-driven PDCA
Just as the process of the decision schema can provoke resistance for the BI team, the process of the schema can also take quite a bit of getting used to for the decision-makers. They have to unlearn to just look in the peep box once in a while and start making daily and weekly decisions based on data from now on.. That involves quite a bit. The illustration identifies the key themes at the heart of data-driven work.
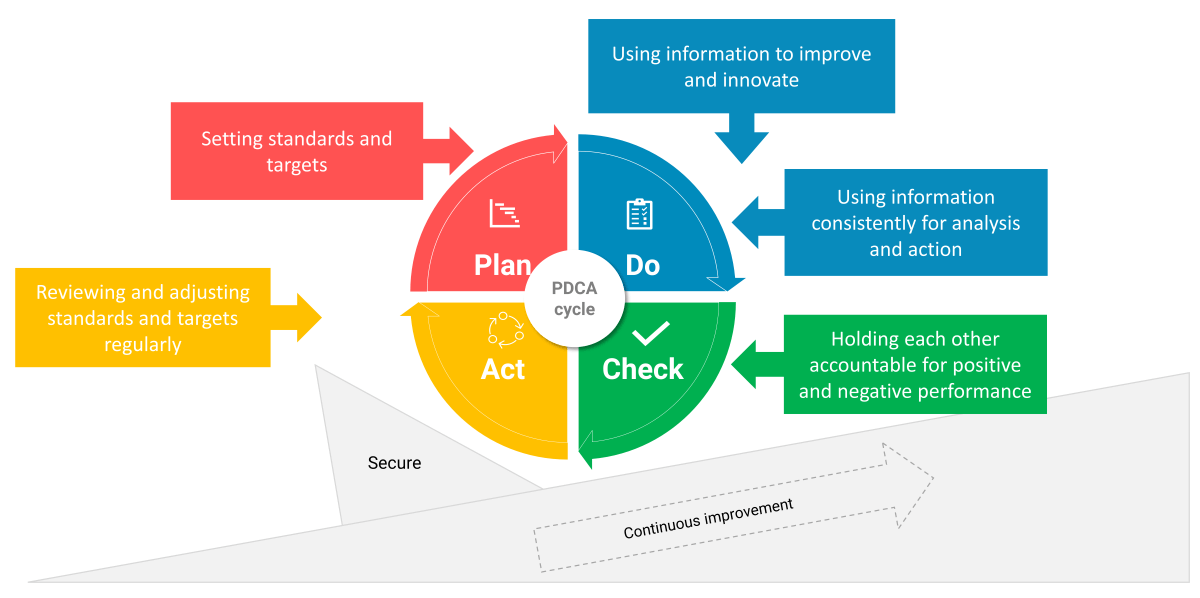 Figure 4: Research has shown that the success of Business Intelligence coincides with establishing a data-driven PDCA.
A good process for the decision schema for the decision makers in the organization (team leaders, managers, directors) looks as follows:
- Evaluate and adjust standards and targets regularly. These are the so-called target values on the KPIs. This assumes that you have established standards and targets. In addition: “regularly” does not mean once a year but much more frequently. Think weekly, monthly, or quarterly. When setting up the norms and targets you base yourself on (historical) data and start differentiating. So not one standard or target for all your products or customer segments, but you are going to make them specific. That’s how you make the P and the A from PDCA data-driven. In the decision schema, the P and the A are mainly hit at the “knowledge” and “experience” block.
- Use information consistently for analysis and action. This may seem obvious, but it still happens far too little and still often far too ad hoc. In day-to-day execution, start using information (and data) consistently for monitoring, analysis, and action. That way you stay on top of things and your actions are driven by data. When norms or targets are exceeded, you look for the root cause. See also our blog ‘Without data analysis, BI is a useless business‘.
- Discuss performance with each other on a daily, weekly, and monthly basis. For both positive and negative performance, have a good conversation: with each other, with your team, or your manager. On a day to day basis, do it more or less informally: take a look at how things went today or yesterday. But weekly and monthly you start analyzing the data more thoroughly and the conversations become more robust.
These three factors are crucial to achieving success with Business Intelligence. Of course, in the beginning, the decision box is not perfect and it is occasionally a mutual search for the right way, tone, and method. When decision-makers are missing data sources or information to move through the PDCA even in a more data-driven manner, the BI team helps them. By the way, you’ll find more information on identifying and setting KPIs, standards, and targets in our SMART KPI Guide.
Tips for creating a dazzling decision box
Everything has to be just right. Not only logically in the brain but also from a passionate perspective, it has to make everyone’s heart beat faster. After all, we are going to put together a dazzling decision box. In growing into maturity, you cannot skip steps and no puzzle piece should be missing. Here are some tips that can help you build a dazzling decision box.
- As an organization, develop a radical vision for BI & data-driven work so that everyone can explain what it is and what contribution it makes to the success of the organization. See also our white paper “The 101 Steps to BI Success“.
- Elevate the decision schemas to a high standard for the further development of your Business Intelligence & Analytics products. Only then will you force each other into BI that will make sense.
- Building according to the decision schemas gives you the opportunity to move from a few big, rough decisions per month or week to a large number of daily micro-decisions. They optimize your processes step by step, make the organization much more agile and your people become less frustrated because there is more grip.
- Organize an inspiration session or training course on data-driven working so that everyone knows exactly what that means. A good understanding is the starting point for growth and innovation.
- Let go of the idea that standards are static and should only be set once. Standardization is a dynamic process where differentiation is the key to improvement.
- Don’t try it alone but do it together. Let Operations, IT, Finance, HR, and BI act together. For example, start by organizing an inspiration session for that group.
- The decision schemas are an excellent stepping stone to implementing Artificial Intelligence. You will soon be able to automate every decision with AI, whether it’s purchasing items or raw materials, scheduling staff capacity, or accepting an insured. That way you can reach the highest level of maturity. But don’t start working with AI without having built and successfully used a decision box for some time.
If you don’t understand or don’t want to understand your own business and process, learning will be difficult. “You see it when you understand it,” Johan Cruijf once said. So look and understand, understand and look. Until you see the light and the penny drops.
Summary and conclusion
In this article, we have reflected on the transition from a paltry peep box to a dazzling decision box. Suddenly it has become crystal clear what causes many organizations to remain stuck at the lowest level of maturity: the peep box has become sacrosanct and people stare blindly at reports and dashboards. With the opening of the decision box, a whole new world unfolds where concrete decisions set the tone. With the help of decision schemas, you can properly design the development for the BI team and the development for the decision-makers. You won’t do that without a fight, but that also makes it much more exciting. Want support in designing and building a picture-perfect decision box? Then contact us here.

Daan van Beek MSc, speaker, trainer and author of the BI & AI book 'Data Science for Decision-Makers and Data Professionals'. He is the CEO of the Passionned Group and you can follow Daan on LinkedIn.