Harness the power of data analysis
Data analysis enables you to examine data in order to better understand what has happened, what is currently happening, why it’s happening, and what may happen in the future. This deeper insight helps you make improvements. With data analysis, decisions can be more effectively substantiated and legitimized. But what techniques and types of data analysis are available? How do you choose reliable tools and relevant software? Passionned Group’s data analysts are here to help you explore all the possibilities. They also support you in developing essential skills in data literacy, training and coaching employees, and selecting the most suitable data analysis programs.
What is data analysis?
 Data analysis is a key component of the broader field of data analytics and forms the undeniable core of both Business Intelligence and Artificial Intelligence. It consists of several subprocesses and typically involves five main steps. But first, let’s define what data analysis actually is:
Data analysis involves a thorough examination of data, which includes collecting, cleaning, combining, and interpreting it.
Defining data analysis isn’t always straightforward, as there is often a lack of clarity about what it truly entails. In practice, terms such as data analysis, data analytics, business analytics, and business intelligence are frequently used interchangeably.
The 5 steps of data analysis
The data analysis process often starts with a clearly defined research question. Take the time to reflect before you begin – careful preparation is essential.
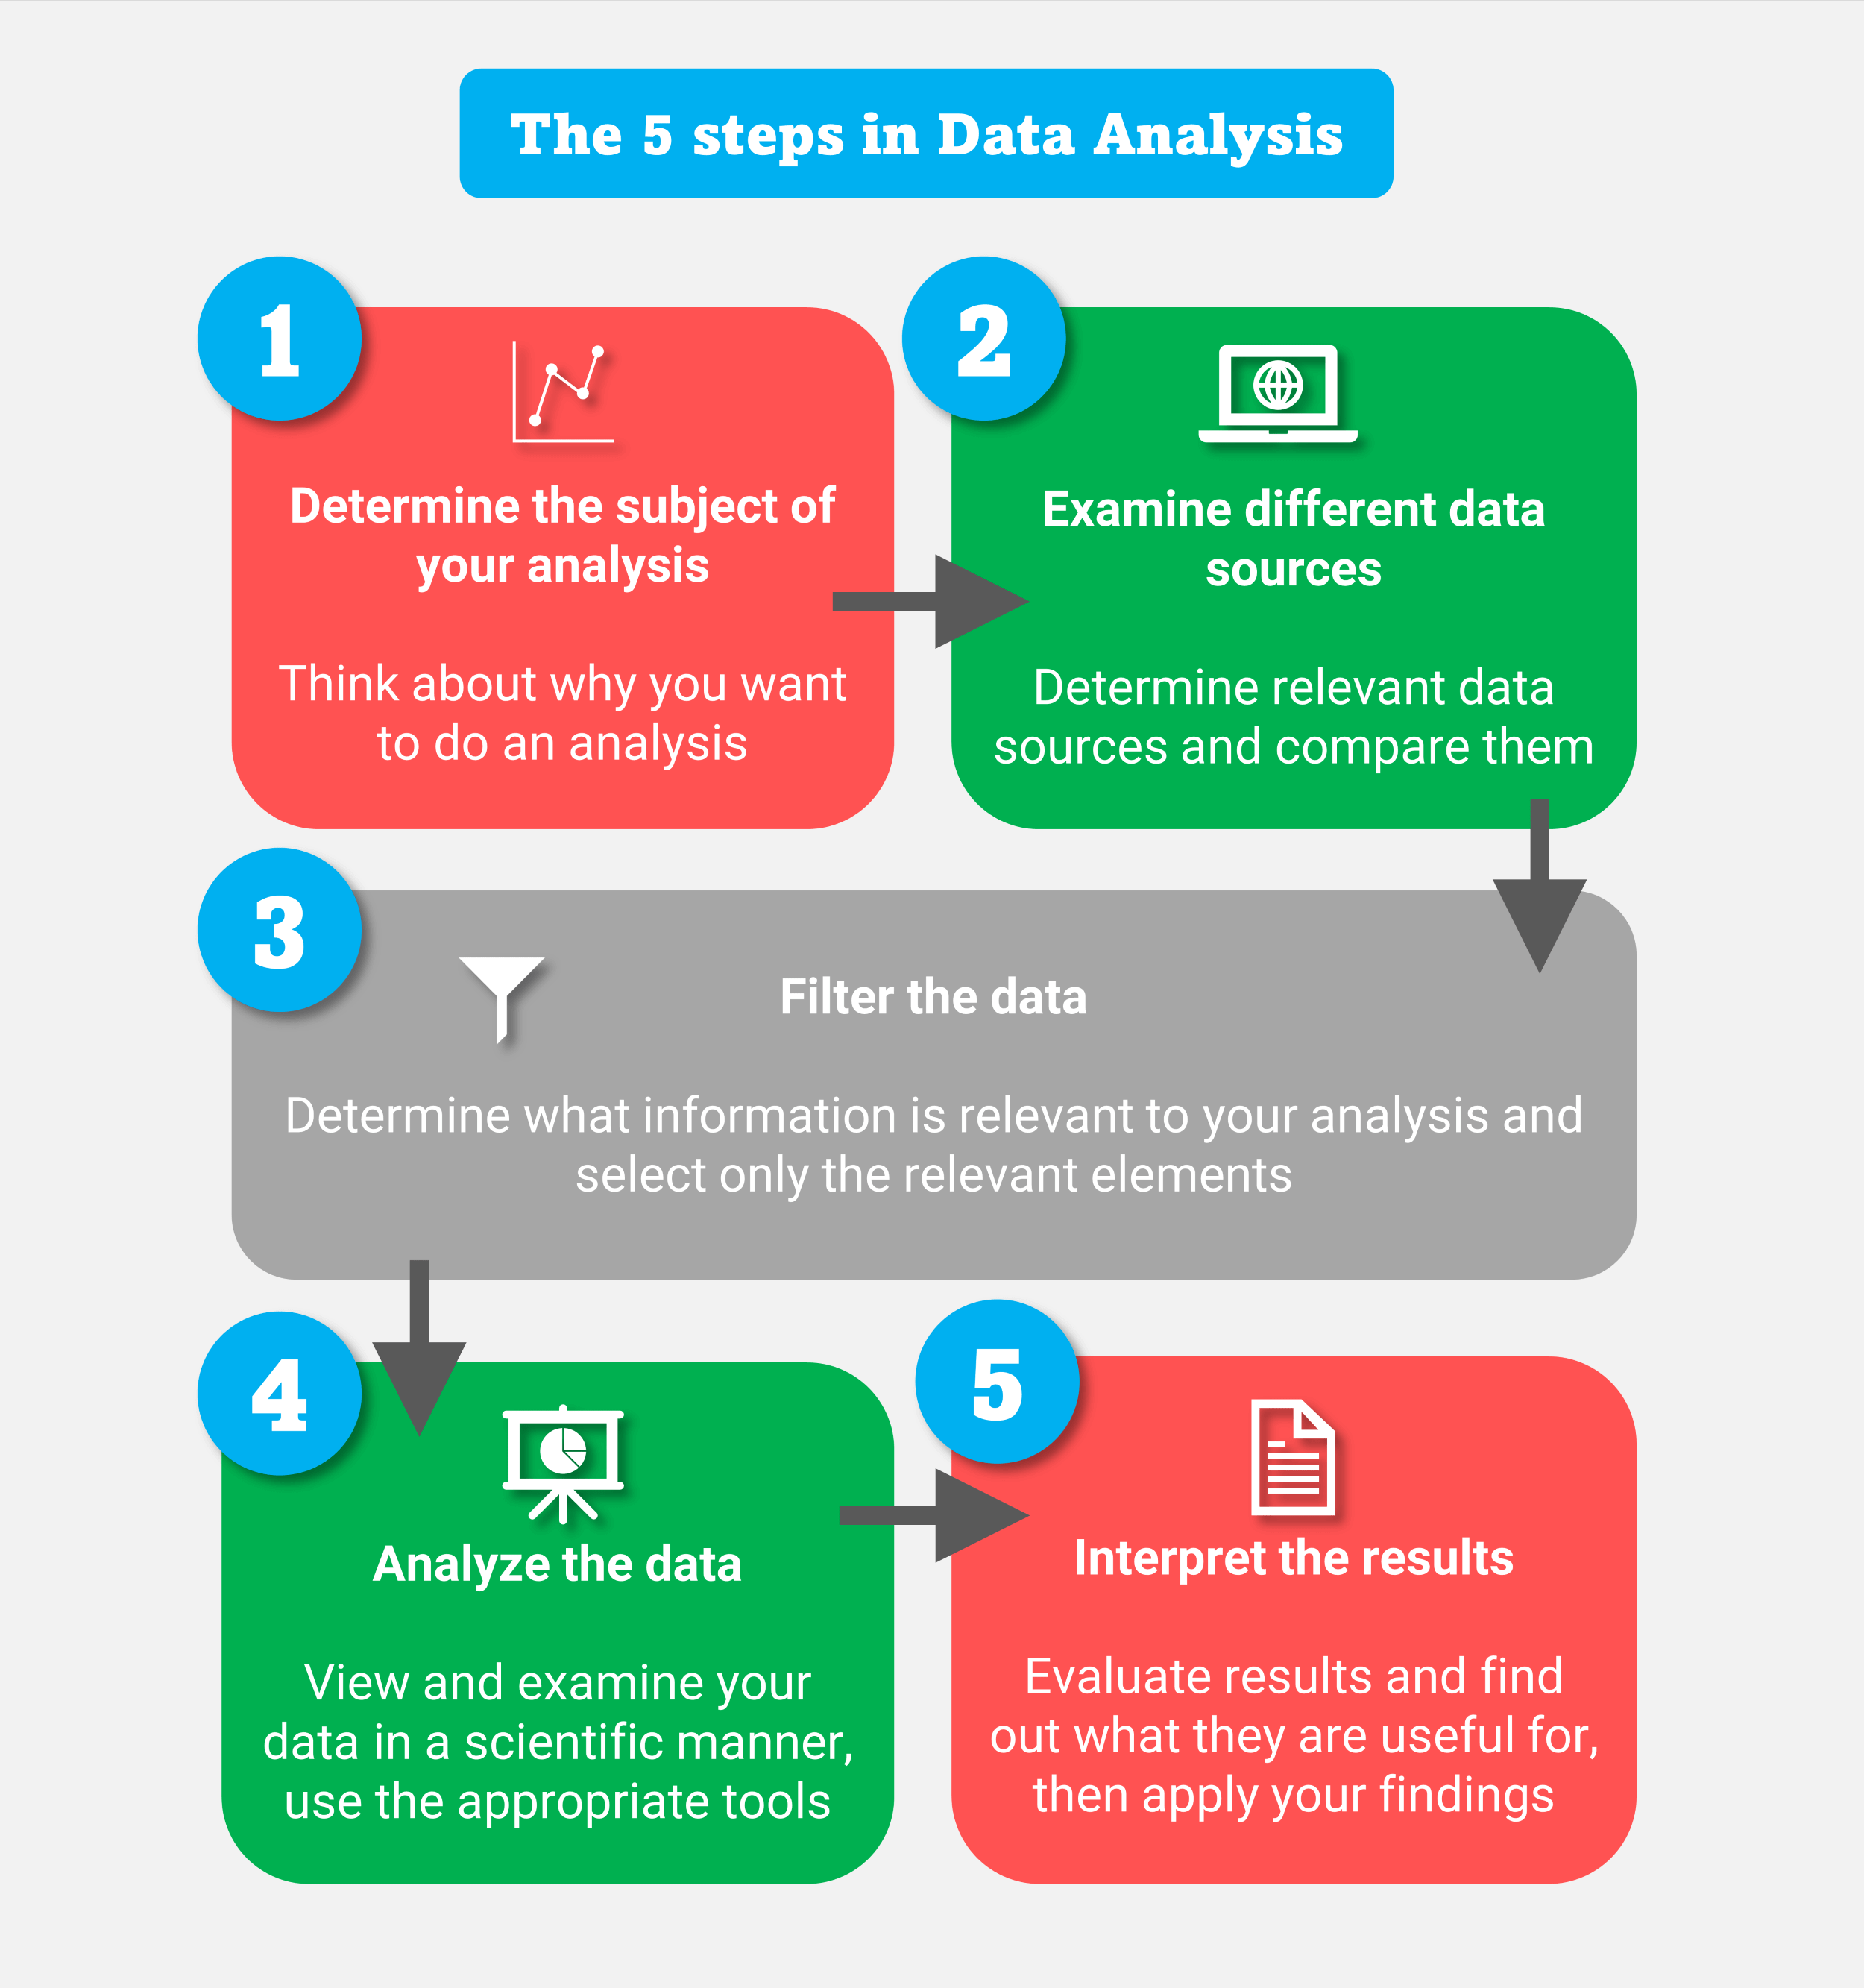 Figure 1: A simplified overview of the five steps in data analysis
- Define the topic: identify the purpose of your analysis and formulate a research question.
- Examine data sources: determine which data sources are relevant and integrate them.
- Filter the data: select the information that is most relevant to your analysis.
- Analyze the data: use the appropriate tools to thoroughly examine the data.
- Interpret the results: assess the outcomes and draw meaningful conclusions.
The objective of data analysis is to produce a dataset containing valuable insights that can support a report, an analysis, or the creation of a dashboard. Naturally, it’s also possible to analyze data without a specific research question – for instance, when exploring the data in an open-ended way.
What is data analytics? What is business analytics?
Data analytics is a broad discipline that leverages tools and dashboards to support decision-making processes within organizations. Popular data analytics tools include Tableau, Google Analytics, and Microsoft Power BI.
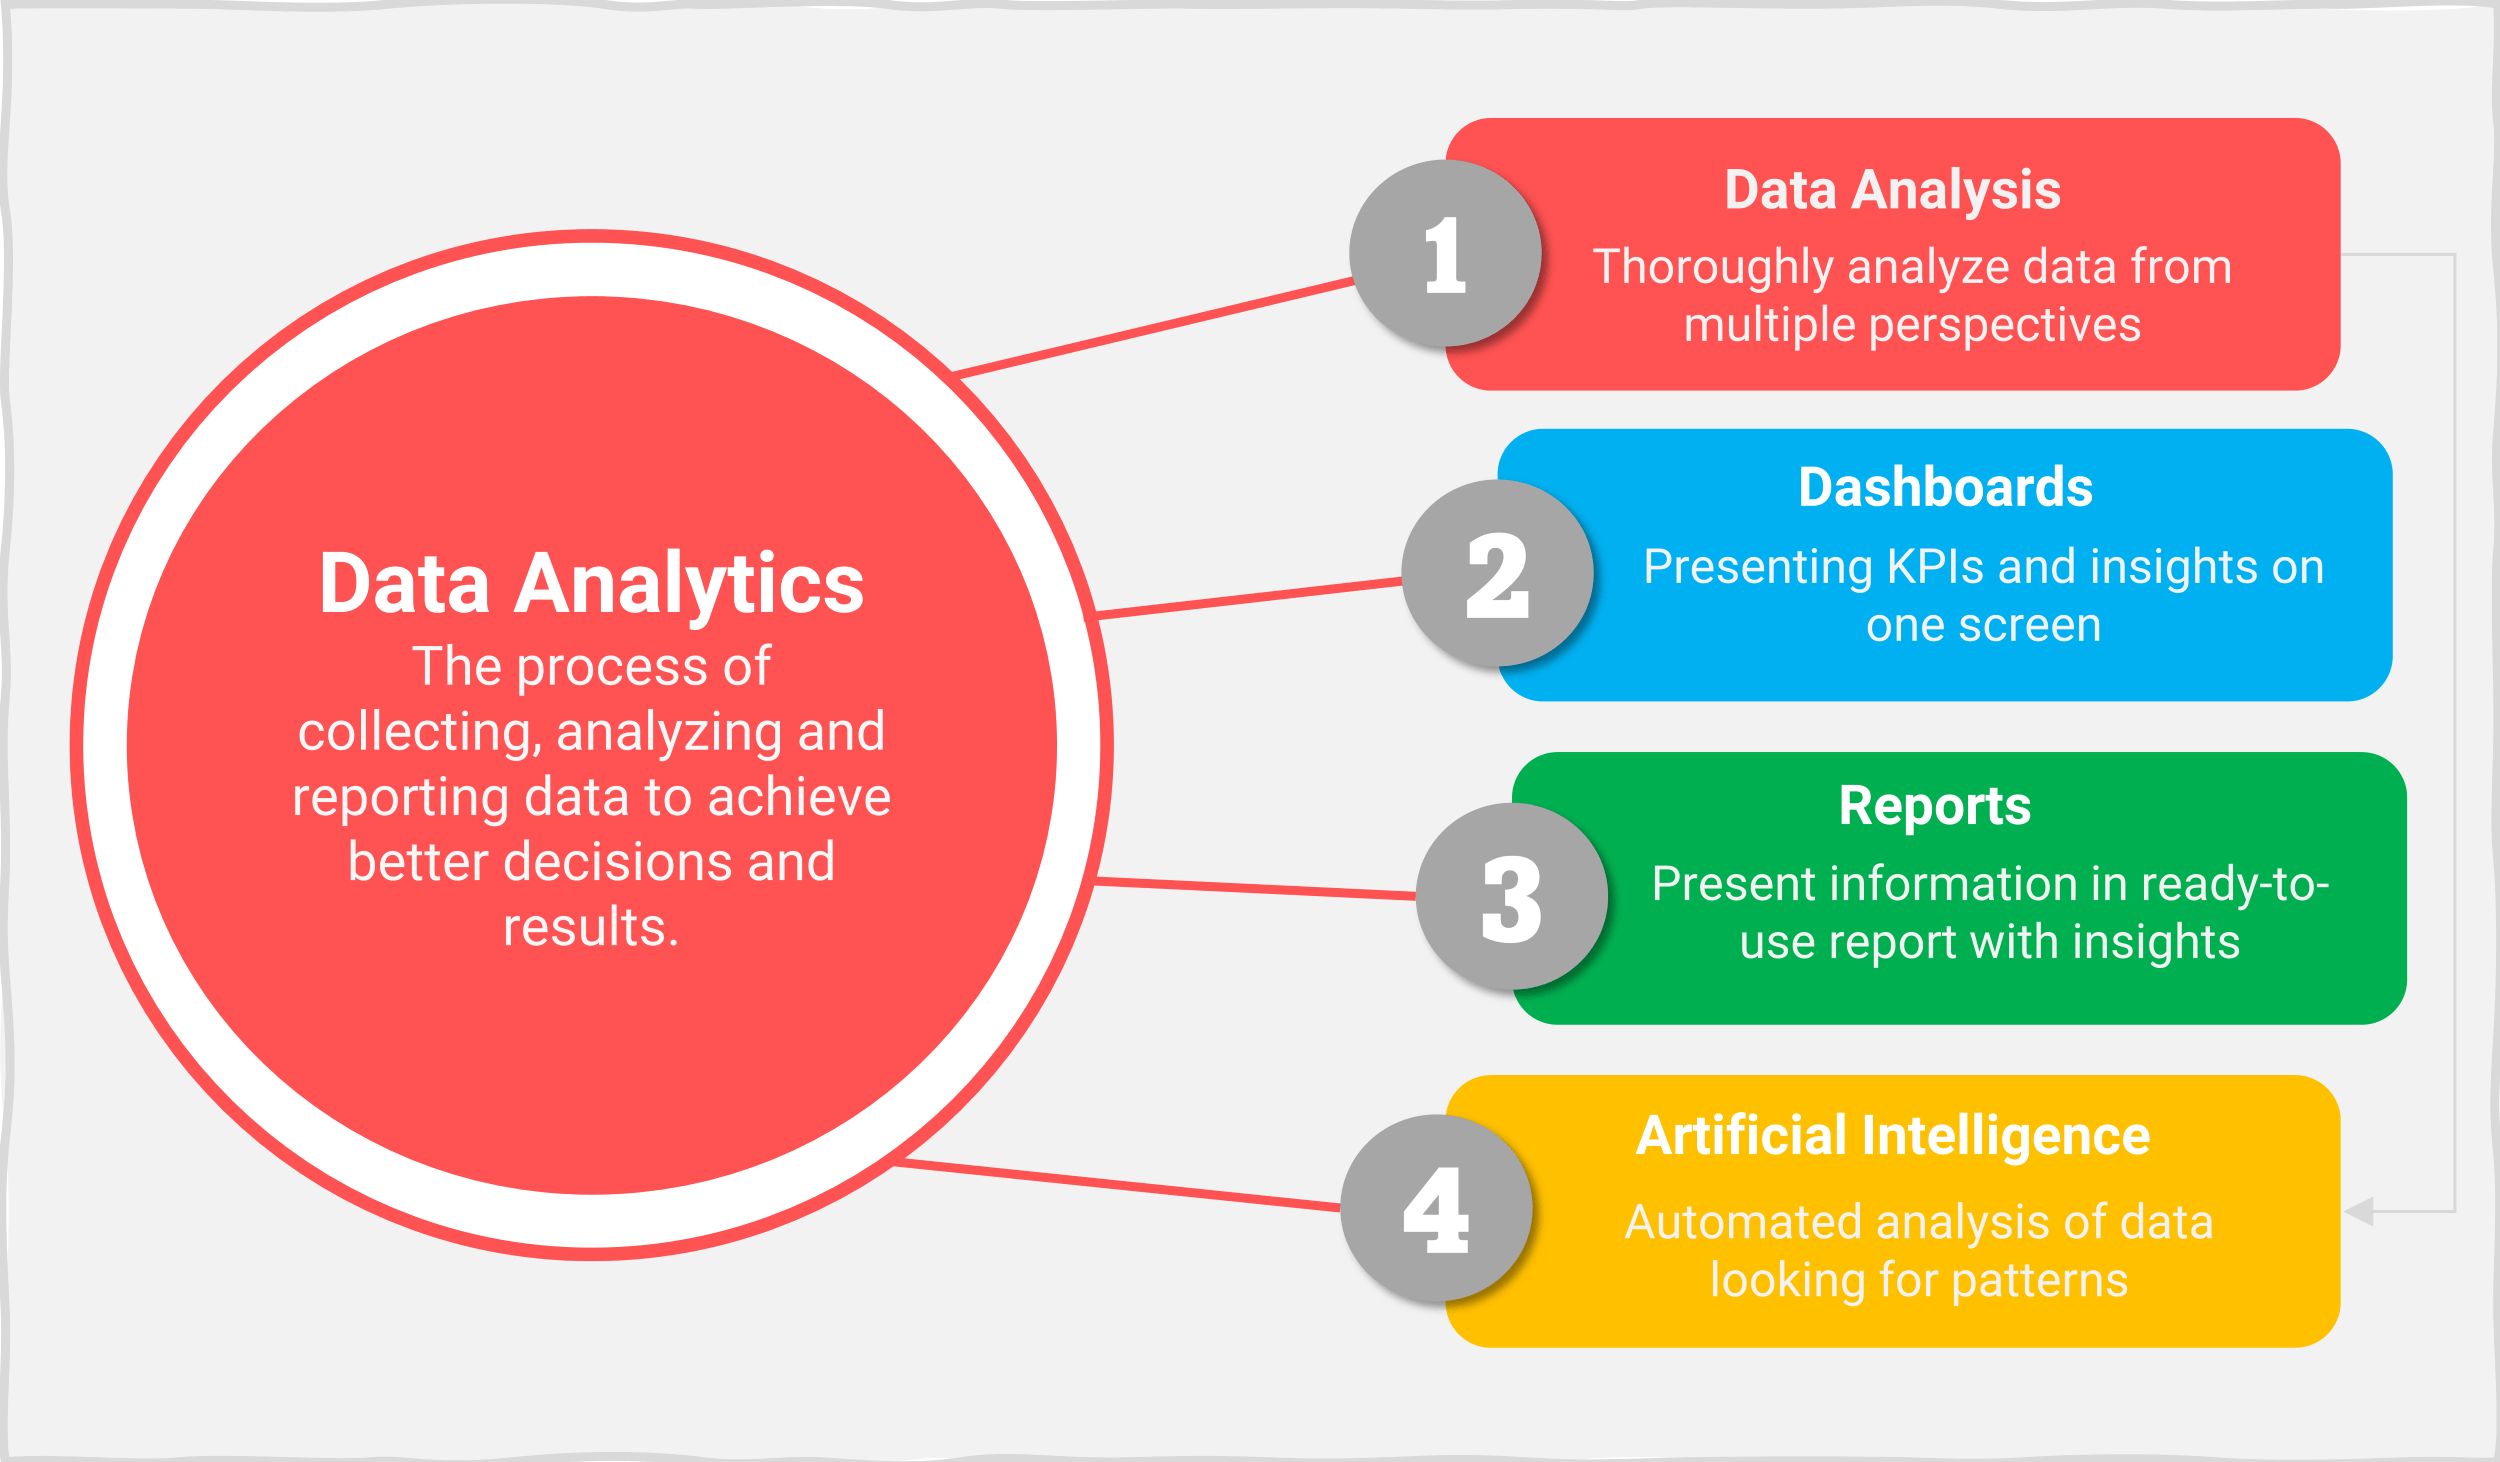 Figure 2: Data analytics serves as an umbrella for numerous applications and tools
As an overarching concept, data analytics uses existing data as its raw material. Ideally, it reveals new trends, insights, and patterns that help simplify and improve business-critical decision-making.
Business analytics, on the other hand, focuses specifically on gaining insights into organizational performance. It involves analyzing your own business outcomes to assess goal achievement, including the monitoring of Key Performance Indicators (KPIs). Business analytics is essentially synonymous with Business Intelligence.
The meaning and impact of data analysis
Surprisingly, many decisions are still based on gut feeling. This shows that there is still significant progress to be made in the field of data analysis. However, since the emergence of big data, the question of why data analysis is necessary is no longer up for debate. More and more people recognize that data is the new gold – capable of revealing valuable insights.
At the same time, there are growing concerns about automation and the rise of an algorithm-driven society powered by artificial intelligence. Some reassurance is warranted. While AI-driven data analysis happens automatically, human judgment and common sense continue to play an essential role. The challenge lies in how to effectively implement advanced data analysis in practice.
But before diving into that, let’s first explore 25 data analysis techniques and address the question: what types of data analysis are there?
Top 25 data analysis techniques
 In addition to the various types of data analysis, there are dozens of more specialized techniques focused on specific topics, disciplines, or industries. Any competent data analyst will be familiar with these and know how to apply them. Below, we briefly highlight 25 such techniques. If you have questions or would like further explanation, feel free to contact one of our data coaches.
- Ad Hoc Data Analysis (Ad Hoc Query): A one-time analysis based on a specific research question, as opposed to recurring reports or structured dashboards.
- Advertising Analysis: Measures the effectiveness of (online or print) ad campaigns using metrics such as reach, conversion, brand awareness, click-through rate (CTR), and cost per click (CPC).
- Basket Analysis (Market Basket Analysis): Common in retail, this technique examines historical purchasing behavior to identify product combinations frequently bought together, supporting cross-selling strategies.
- Churn Analysis: Predicts which customers are likely to leave for competitors. Churn rate is a key indicator of customer value.
- Cluster Analysis: Groups data into clusters with shared characteristics, helping to identify natural segments within a dataset.
- Cohort Analysis: Analyzes behavior of groups (cohorts) who share a common characteristic or event within a specific time frame, revealing patterns over time.
- Correlation Analysis: Shows the strength and direction of the relationship between two variables, represented on a scale from -1 to +1.
- Customer Profitability Analysis: Determines the profitability of individual customers, helping identify which customer relationships are beneficial in the long term.
- Customer Lifetime Value (CLV) Analysis: Predicts the total profit a customer is expected to generate throughout the relationship with the company.
- Depth Analysis (Drilldown Analysis): Begins with a high-level overview, then allows deeper analysis into detailed layers – for example, from province to city, then to postal code level.
- Discriminant Analysis: A statistical method used to assign new observations to predefined groups based on their characteristics.
- Financial Data Analysis: Evaluates organizational performance based on profitability, solvency, liquidity, and financial stability.
- Funnel Analysis: Maps the stages a potential customer moves through on a website before converting, visualizing the customer journey. View our approach ‘The Data-driven Growth Accelerators‘, with which we develop SMART funnels.
- Fuzzy Logic: Uses probability rather than binary values, allowing for reasoning with uncertain or imprecise information.
- Geospatial Analysis (Geo-Analysis): Utilizes geographic or location-based data to uncover spatial patterns and trends, applicable in areas like marketing, meteorology, and logistics.
- Critical Path Analysis: Tracks project timelines, identifying tasks that directly impact the overall project completion date.
- Multivariate Analysis: Examines relationships between more than two variables simultaneously, often to understand complex interdependencies.
- Retention Analysis: Assesses how well an organization retains employees or customers, reflecting loyalty and satisfaction levels.
- Root Cause Analysis (RCA): Investigates the fundamental reasons behind a problem or failure in a process or system.
- Sentiment Analysis: Automatically or manually classifies opinions in social media or other text as positive, negative, or neutral to track sentiment trends over time.
- Simulation Analysis: Replicates real-world processes using models or computer programs (e.g., Monte Carlo simulations or Digital Twins).
- Spend Analysis: Involves collecting, categorizing, and evaluating all organizational spending to inform procurement and cost-saving strategies.
- Text Analysis (Text Mining): Analyzes large volumes of unstructured text data to uncover patterns, sentiments, or key issues.
- Web Scraping: Uses software to extract and analyze data from websites for specific analytical purposes.
- White Spot Analysis: Identifies untapped market opportunities, such as geographic areas without store presence or product gaps in customer purchase behavior.
Types of data analysis
Data analysis comes in many forms. One of the most widely recognized classifications is Gartner’s growth model, which outlines four main types of data analysis (see Figure 3):
- Descriptive analysis
- Diagnostic analysis
- Predictive analysis
- Prescriptive analysis
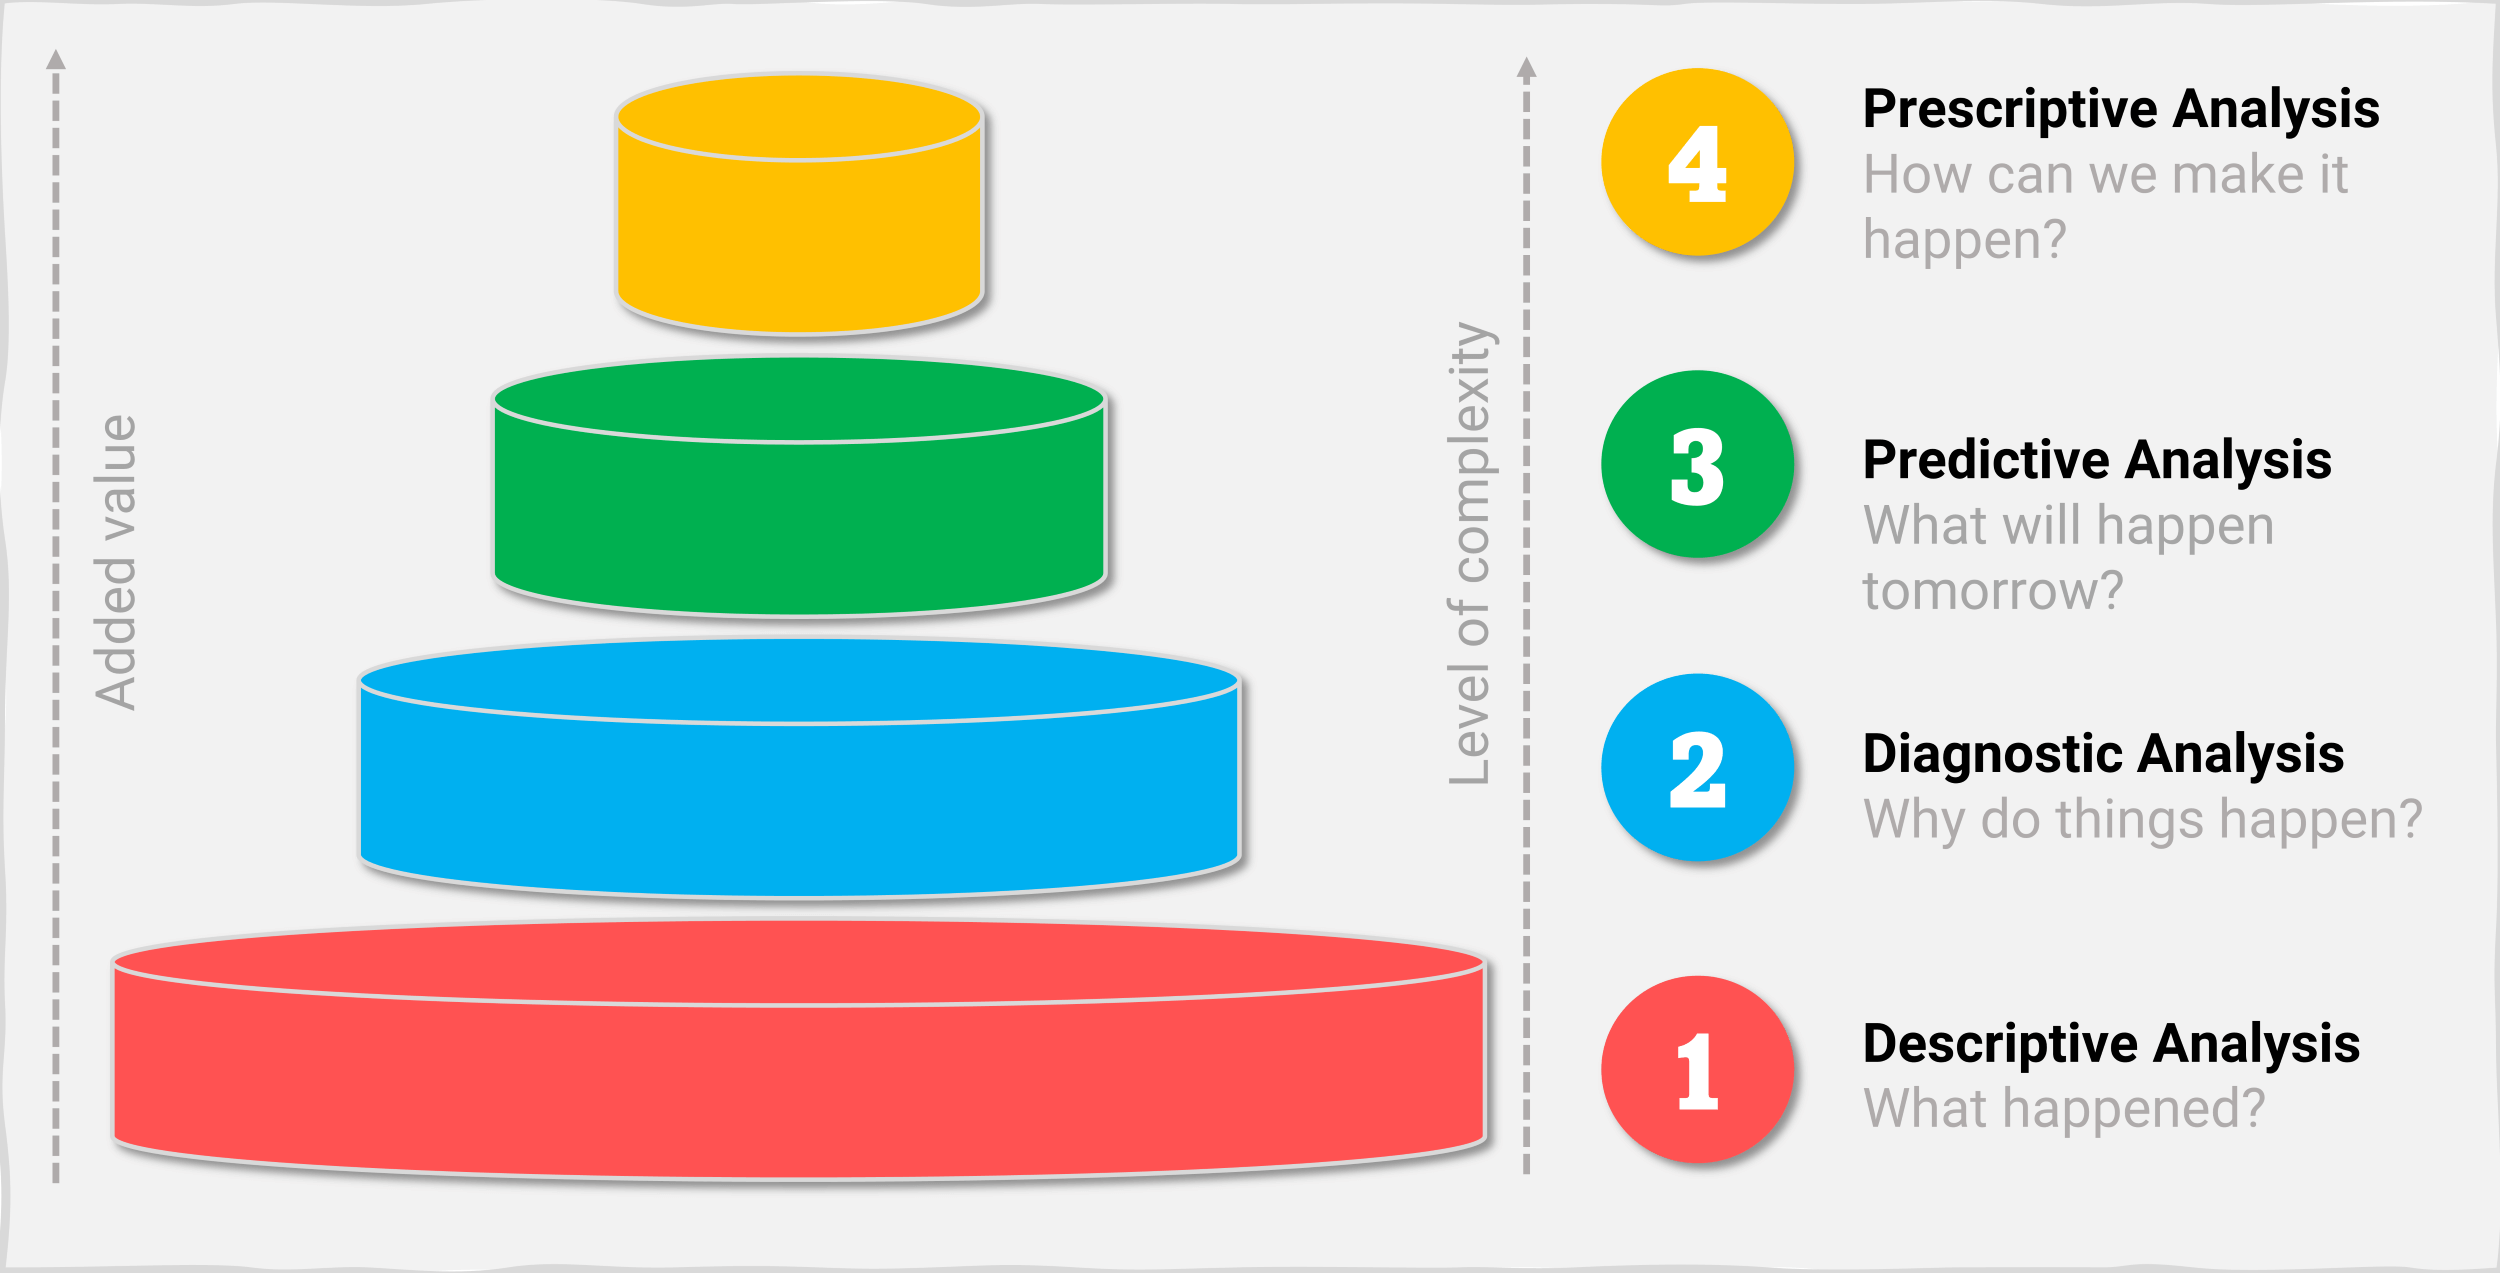 Figure 3: The four stages of data analysis represent a progression toward data maturity
This model reflects an organization’s journey toward maturity in data analytics.
Data analytics as a competitive advantage
Organizations that consistently analyze customer data or conduct sentiment analysis on social media gain a clear edge. Robust data analysis helps product managers avoid costly marketing missteps. Automated data analysis in aerospace facilities and oil rigs prevents expensive downtime. Governments apply advanced analytics to evaluate the effectiveness of their policies, while accountants and controllers use statistical methods to uncover large-scale (international) fraud.
Small and medium-sized enterprises can also benefit significantly from solid data analysis. It doesn’t require massive investments. Accessible, standardized analyses – such as tracking visitor behavior in a store or on a website – can already reveal valuable insights. Be sure to read our blog on customer data analysis to enhance your marketing strategies.
The BI & Analytics Guide™ 2026 With our BI & Analytics Guide™, you are always just one or two clicks away from relevant content (based on 250+ selection criteria) in the areas of Business Intelligence, AI and Analytics. Rate each vendor based on market dominance and functionality and quickly shortlist vendors that meet your (knockout) selection criteria. It can also be used as an interactive online course for your BI team.
Research: data analysis software & tools
 Passionned Group has developed several online comparison guides, including the Business Intelligence & Analytics Guide 2026, which enables you to easily compare BI and data analysis software vendors based on criteria relevant to your organization. The guide features over 250 selection criteria organized in a layered structure, with drilldowns extending up to three levels deep.
In addition, Passionned Group provides detailed, up-to-date profiles of each vendor’s product and service offerings, highlighting the most relevant data analysis tools and software releases. For example, explore the page on Microsoft BI tools, read the focus article on Tableau Software, or review the research on Qlik Analytics.
Make room for data analytics – but don’t forget your people
 Keep in mind that investing in data analytics, software, and tools only makes sense if you also invest in the data literacy of your people. Be sure to allocate part of your budget to education and on-the-job training, so your employees continuously develop the skills they need.
More information
Are you looking for in-depth data analysis, strategic advice, or interim support? Contact us today. Our data analysts and experts are ready to assist you.
About Passionned Group
![]() Since 2004, Passionned Group has specialized in designing and implementing data-driven, intelligent organizations. Nearly all of our affiliated consultants, trainers, and interim advisors have extensive knowledge and experience in data analytics.
Since 2004, Passionned Group has specialized in designing and implementing data-driven, intelligent organizations. Nearly all of our affiliated consultants, trainers, and interim advisors have extensive knowledge and experience in data analytics.
Frequently Asked Questions
How do you start a data analysis process?
The data analysis process typically begins with a clearly defined research question – unless you’re engaging in open exploration to uncover valuable insights. See the 5 steps.
What is the importance of data analysis?
Data analysis is essential for achieving better performance. Large-scale studies show that while many organizations create reports and dashboards primarily to justify past actions, they gain little real value from their data. In contrast, the most forward-thinking organizations continuously analyze their data to extract meaningful insights. Data analysis forms the core of Business Intelligence and Artificial Intelligence.
Is data analysis easy?
No, it’s far from simple. The best data analysts possess an insatiable curiosity to uncover hidden patterns in data. They have advanced analytical skills that help them answer complex questions, along with patience and persistence. Our data analytics training courses outline what it takes to become a highly effective analyst.
What does data literacy entail?
Data literacy is the ability to read, interpret, work with, analyze, and communicate data effectively. It enables you to understand and use information purposefully – making it a vital skill for any data analyst.
What is the relationship between data analysis and AI?
Artificial Intelligence automates data analysis using machine learning models trained on large datasets. While humans might consider four or five variables at once, AI can process tens of thousands or more simultaneously.
Are data analysis and data analytics the same?
No, they’re not the same. Data analysis is a part of data analytics. It focuses on cleaning, integrating, and interpreting data to answer specific questions. Data analytics is broader and includes data analysis, but also covers discovering patterns, trends, and using data to support strategic decision-making.
What is the difference between data analysis and quantitative research?
In practice, there is a clear distinction: quantitative research always starts with a defined research question, and data analysis is a component of that process. However, data analysis can also be conducted without a specific question – this is known as Exploratory Data Analysis (EDA). In EDA, you’re not conducting academic research, but rather generating potentially valuable business insights.