The meaning of KPIs: measure, improve, and accelerate your growth
A KPI, or Key Performance Indicator, provides sharp insight into what’s happening within a process and how effectively it is functioning. Examples include the number of orders processed per day, weekly revenue, vacancy rates by district, or warehouse throughput times. Some KPIs are strategic, offering a clear view of progress toward critical goals; for instance, a retailer aiming to grow from 50 to 70 stores within two years can use KPIs to track this expansion. Effective KPIs drive growth for organizations, teams, and managers, but creating and working with them requires expertise and a strategic approach. In this article, we define what a KPI is, explain how to set them up, and clarify their purpose. Understanding the different types of KPIs is crucial; without this knowledge, effective steering is impossible. Finally, we discuss the 10 most common KPI challenges and solutions.
What is a KPI?
The acronym KPI stands for Key Performance Indicator. A KPI measures a key value in your process, but the real question is: what can you learn from this value, and how will you act on it? Interestingly, the three letters KPI can also stand for: Keep People Inspired, Keep People Informed, or Keep People Involved. This highlights the importance of ensuring that people engage with KPIs and use them meaningfully. KPIs are used in two main ways:
- To actively steer or adjust your direction.
- To justify and account for actions taken.
KPIs are primarily used to steer and provide accountability at the levels of teams, departments, processes, and the organization as a whole. Our definition of a KPI is as follows:
A KPI is an indicator that shows what is happening in a process and how well it is performing. Pure KPIs serve as the factual foundation for process improvement and accountability.
KPIs are a vital part of any performance management system. Without well-defined KPIs, it is impossible to manage your organization and teams effectively, make adjustments, or confidently make data-driven decisions. Measuring provides the insights needed to improve. KPIs are typically presented in reports or dashboards, often using graphs or gauges. They are frequently plotted over time to monitor trends and score developments. The data used to build KPIs is analyzed with specialized tools.
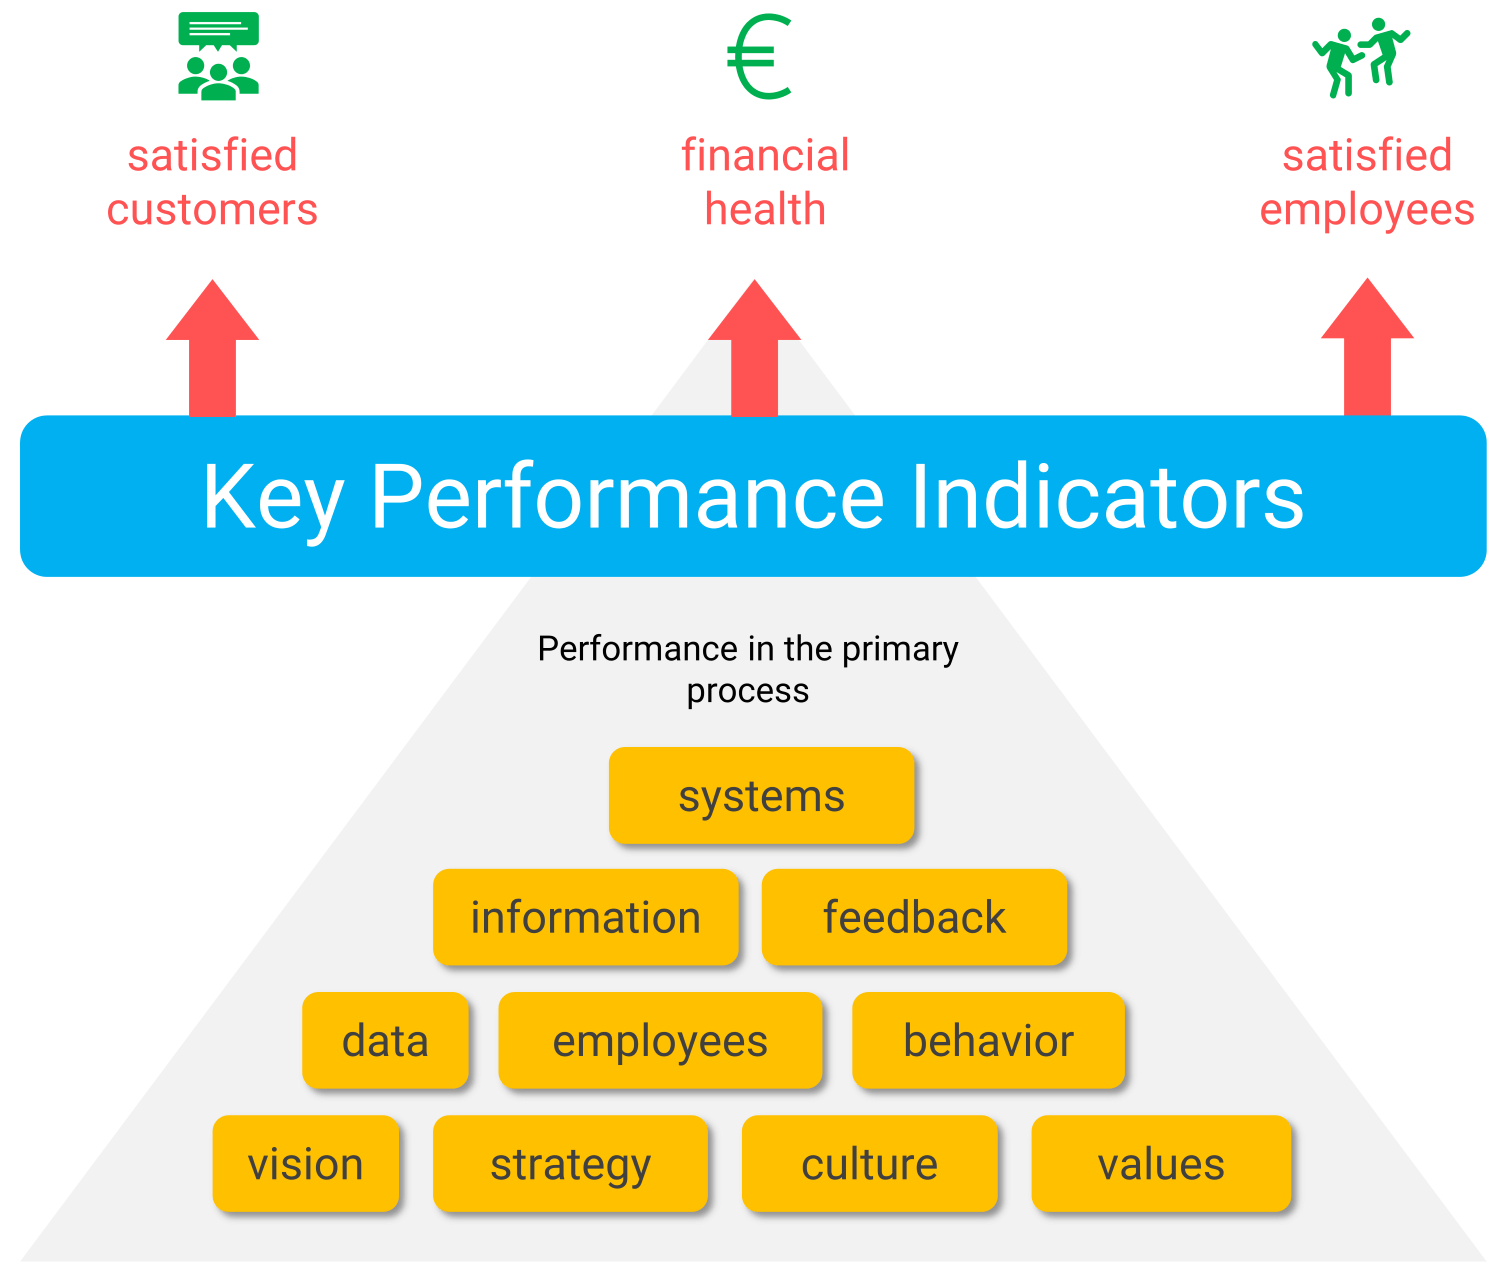 Figure 1: All kinds of factors influence scores on KPIs. Keep them in mind. A well-designed KPI should have a direct impact on financial health (profitability), as well as on employees and customers.
A performance-driven culture and high employee engagement are critical for success. Without motivated and committed employees, KPIs can feel like a red flag to a bull. To make KPIs effective, ensure they are appealing to employees. As a manager, give KPIs meaning and context, set them collaboratively with your team, and prioritize passion and job satisfaction.
Hit the essence: what is the purpose of a KPI?
 Creating KPIs is never an end in itself. Without focus, you can end up with a cluttered array of indicators. Remember, less is more. KPIs must address the core of your business, with executives providing meaning through clear explanation. Every professional organization strives for three key objectives: satisfied employees, satisfied customers, and profitability (a healthy financial balance sheet)—ideally in that order. See Figure 1. Specifically, KPIs are designed to:
- Provide insights into the performance of the organization, process, or team
- Motivate employees and managers to improve KPI scores
- Steer and adjust actions to achieve desired values
- Provide accountability to stakeholders regarding performance
- Professionalize the organization and its processes further
- Improve employee well-being and enhance customer value
These are compelling reasons to get started with KPIs. Satisfied employees create happy customers, who, in turn, are more likely to spend. Conversely, dissatisfied employees can drive customers away, impacting sales negatively. Customer satisfaction, employee satisfaction, and profitability are the key result areas for any organization (see Figure 2). A hallmark of a well-defined KPI is its ability to directly impact all three result areas when used effectively.
Important: there are four different types of KPIs
In practice, all indicators are often referred to as KPIs, but in theory, there are distinct types. Understanding these differences is crucial:
- Key Result Indicator: also referred to as KRI, summarizing organization-wide results of collective efforts. Examples include customer satisfaction, employee satisfaction, profitability, and sustainability. KRIs reflect overall performance. Read more about KRIs.
- PI and IND: these indicators measure specific aspects of a process or organization. Performance indicators (PIs) include margin, absenteeism, or market share growth, while common indicators (INDs) include metrics like the number of new employees or FTEs. Read more about performance indicators.
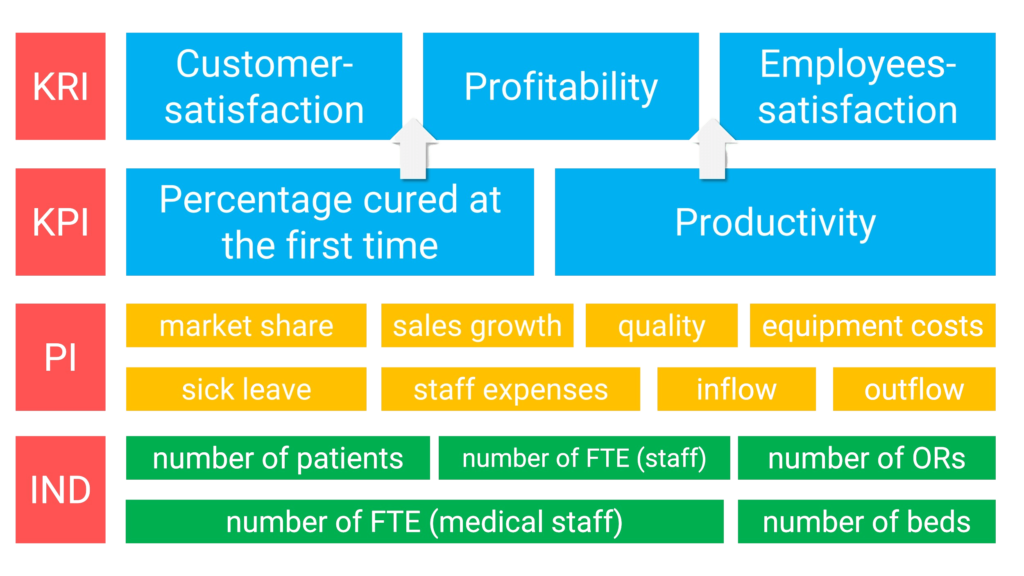 Figure 2: The four types of KPIs are Key Result Indicators, core KPI, Performance Indicators, and Indicators.
- The core KPI: This is the most critical category and focuses on the primary process, driving better performance and adding value. Examples include vacancy rates, failure rates, or process waste. These KPIs often highlight issues (e.g., waste) to drive improvement.
Steering with core KPIs is the most effective way to improve scores on one or more KRIs. The key is to distinguish between cause (core KPI) and effect (KRI). For example, a pastry chef discarding unsold bread or pastries at the end of the day not only incurs financial losses (impacting profitability) but also demoralizes staff who baked and stocked the goods in vain (affecting employee satisfaction). Additionally, such waste is inherently unsustainable. Core KPIs are often framed negatively, and this approach serves a specific purpose.
Tip: Focus on essential KPIs to simultaneously improve profitability, customer satisfaction, and employee well-being. They are also ideal for continuous improvement processes.
Monitoring & analyzing: how to visualize a KPI?
KPIs are typically visualized as gauges or graphs on dashboards or reports. This makes it easy to monitor and analyze organizational, process, or team goals at a glance and make necessary adjustments.
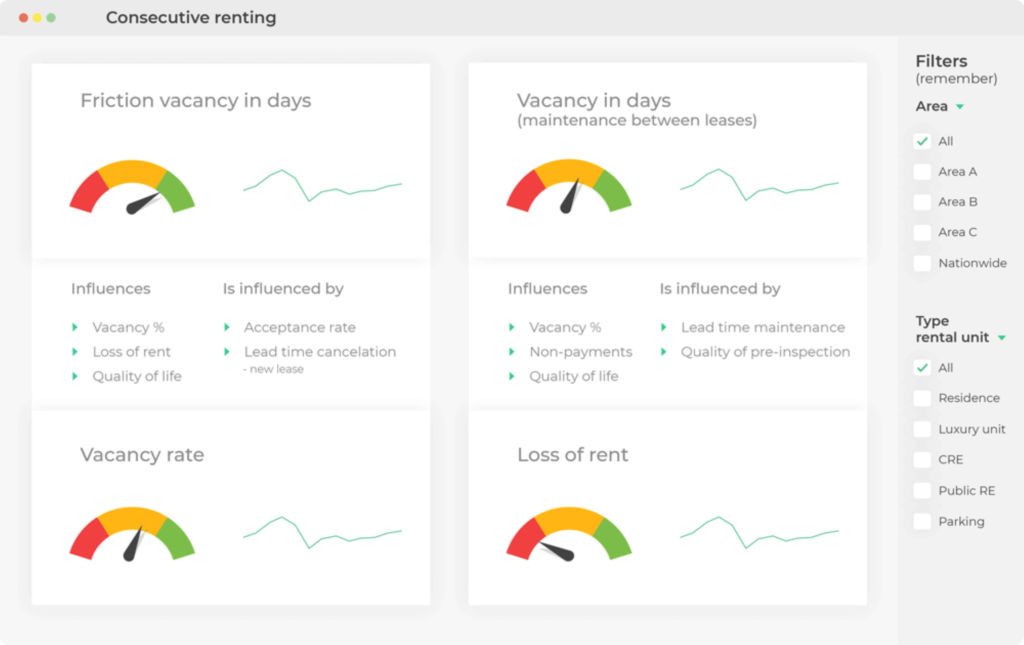 Figure 3: Example of a KPI dashboard for the housing sector.
A KPI dashboard highlights the milestones needed to achieve ultimate goals. For instance, consider energy consumption at home. In some cases, it may be possible to track usage monthly, weekly, or even hourly, along with associated costs. If your goal is to stay within a certain threshold, you can take action to save energy when necessary. However, limit the number of dashboards to avoid unnecessary complexity.
Now that you understand the fundamentals of KPIs and their importance, let’s dive into setting up KPIs and how to start steering effectively with them.
Setting up your KPIs from four angles in 9 steps
Setting up KPIs for your team, process, or organization is a complex task. Without careful planning, you may end up with too many KPIs, ones that lack actionable insights for users, or even metrics that cannot be influenced or calculated. To ensure effective KPIs, we approach the task from four key angles, ideally starting with the first:
- The organization’s mission and strategy: through this angle, you can easily identify critical success factors and define concrete KPIs. For example, consider the KPI tree we developed for a hospital. Sometimes, you can pinpoint KPIs even faster: the fire department’s mission is “to save people and animals.” Based on this, you can measure how many lives were saved or reasonably estimate how many were prevented from becoming victims. While effective, this approach might not always capture KPIs that measure the performance of the operational and tactical processes ensuring the mission is fulfilled. For those, the funnel and process offer answers.
- The funnel, the process, and the customer journey: every process includes a funnel, where more inputs typically flow in than outputs flow out. Common KPIs in this context include inflow, outflow, throughput time, and work inventory. For example, many candidates might apply for a vacancy (inflow), but only one is hired (outflow). Similarly, visitors to our website can register for various training programs. Some may register immediately (outflow), while others download a brochure first (inflow), and some drop off if the program doesn’t suit them (direct outflow). Comparing inflow and outflow allows you to calculate the conversion rate of the funnel, putting you on the right KPI track!
- Decisions: throughout a funnel, decisions—both conscious and unconscious—are made. For example, deciding whether to invite a candidate for an interview or hire them further along the process. How do you measure the quality of such decisions? One indicator is how long the new hire stays on the job. If they don’t pass probation or leave within a year, the decision may not have been ideal. If they stay much longer, it’s likely a good decision. Identifying decisions in your funnel can reveal valuable KPIs.
- The data: examining your data can also reveal potential KPIs. For instance, to determine the number of orders, count the records in the order table of your system. You can also calculate sales by analyzing the number of products ordered, quantities, and prices. This approach often yields a large number of KPIs, but are they all equally relevant for improving decisions? Finding the sweet spot between data abundance and relevance is the hallmark of a data-driven organization.
By addressing these four angles—strategy, funnel, decisions, and data—you can systematically identify meaningful KPIs. But this is only the beginning.
Go through the step-by-step plan
Establishing KPIs involves not only identifying them but also defining them and populating them with data. Follow these steps to set up your KPIs:
- Identify the KPIs using the perspectives outlined above
- Define the KPIs from a functional perspective by creating a functional formula
- Define the KPIs technically by specifying the exact data-based calculation
- Have the definitions reviewed by management, IT, and finance & control
- Process the feedback and document the definitions in a database or a document
- Make the definitions accessible to all KPI users
- Start calculating KPI scores using the available data
- Discuss the scores with users and gather their feedback
- Refine the definitions, update them (step 5), and obtain official approval
Once these steps are completed, you can begin actively steering with and on the KPIs. First, we’ll share 5 practical tips to help you identify KPIs in your organization effectively.
Another 5 tips for identifying essential KPIs
Eager to start identifying the right KPIs for your organization but finding it challenging? Here are 5 practical tips to help you discover the most essential key performance indicators:
- Think in disaster scenarios: if you can’t immediately pinpoint your organization’s key performance indicators, imagine the worst disaster that could strike your organization, division, or department. If that seems unlikely, move on to the next potential disaster, and so on.
- Consider time: processes often fail when tasks aren’t completed or delivered on time. Many KPIs relate to time, such as lead time and productivity, making it a critical focus area.
- Ignore financial indicators: while true KPIs always have a financial impact, they themselves are never financial metrics—there’s no dollar sign in front of them. In your search for true KPIs, leave out purely financial indicators.
- Focus on satisfied customers: high customer satisfaction often points to effective KPIs. Ask yourself: What makes your customers exceptionally satisfied?
- Evaluate infrastructure critically: if your processes rely heavily on specific infrastructure or if it’s core to your business, this can highlight potential KPIs. For example, in mobile networks, disruptions are often critical to maintaining performance and achieving results.
Want more tips? Our complete KPI guide for 2025 includes over 750 detailed examples and a proven method to quickly determine the right KPIs for your organization.
Steer with KPIs that score
Steering and accountability go hand in hand when you put core KPIs at the center. Then you don’t even have to set up a separate reporting line for accountability and that is pure profit: two sides of the same coin. To effectively manage KPIs and score, the following conditions are key:
- A KPI needs a standard or target value. This is the target value, your SMART goal towards which you want to move. Without a target, of course, you cannot steer well and it also makes little sense to discuss the scores on the KPI’s with your team because then what is the conversation about? The intention is to raise the bar a little higher each time. This is the only way to create a culture in which colleagues think about how they can improve their own performance. You also differentiate the standards and targets according to time (think of seasonal patterns), per product group, per department or location. After all, you can’t lump everything and everyone together. Read more about SMART goals here because before you know it, a standard turns into an unachievable or unattainable goal.
- You discuss the KPI scores with your team on a daily, weekly and monthly basis. This is how you create commitment. You set up a discussion cycle in which you discuss the KPI dashboard and the scores. You do this carefully and together and you give each other feedback and tips. Quarterly or annually you report the scores on the KPIs to the Supervisory Board, shareholders or the government. But keep a sharp eye: horizontal management (teams) always takes precedence over vertical management (hierarchy).
 The SMART KPI Guide is a clear handbook for any organization that wants to achieve success with performance management, KPIs and data-driven work. This thorough guide supports you at every stage: from identifying and defining KPIs, loading, standardizing, visualizing to working with KPIs on a daily basis. A rapidly growing number of organizations (2,500+) are using the SMART KPI Guide as their digital assistant. This complete guide contains more than 750 KPI examples from 24 different industries, giving you access to a wide range of best practices and case studies.
- During the conversations you will reflect on the scores together: are you on the right track, how well are you doing, what could be better and how are we going to adjust? Then it is important to find out the root-cause why a KPI does not reach the standard. You do this through thorough data analysis. From bottom to top, left to right, you turn the data inside out and analyze it until you have found the actual problem.
- You’re going to solve the problem together, and you’re going to implement the solution found into your process. Immerse yourself in process optimization.
These four conditions form the core of successful steering with KPIs. Here you are going to set up the PDCA cycle with the KPIs as a common thread. This requires management that embraces data-driven work and puts it into practice, but it also requires teams and employees to be closely involved in the organization, process optimization and results.
Get inspired by 750+ KPI examples
 A KPI is not something you can simply create without thought. Like a true detective, you need to thoroughly examine your business processes and data to identify the performance indicators that truly matter. At Passionned Group, we’ve done much of the groundwork for you. With over 20 years of experience, we’ve developed a database of more than 750 practical KPI examples across various industries. We are giving away the first 25 KPI examples here for free. All other KPIs can be viewed when you order the SMART KPI Guide 2025.
- Airline delay: the number of flights that arrived on time as scheduled relative to the total number of flights. Also visualized as the average delay per aircraft expressed in number of minutes.
- Bed occupancy in a hospital: the number of beds occupied relative to the total number of beds available each day.
- Hotel occupancy rate: the number of rooms occupied relative to the total number of rooms available.
- Employment rate by municipality: the number of citizens who are employed relative to the total number of citizens who want or need to work.
- Downtime at a bank: the percentage of time a banking app or website is down, such as due to an outage.
- Hit ratio at an employment agency: the number of placements relative to the number of candidates proposed.
- Construction overrun: the delayed completion of construction projects, to be measured as the excess of the contractually agreed construction time, expressed in days.
- Vacancy at a housing association: the average number of days a property is vacant or the percentage of homes that are vacant compared to the total stock.
- Returns at a webshop or store: the number of items returned relative to the total number of items sold.
- No-show at a mental health institution: the percentage of client appointments that could not take place because clients did not show up.
- Dollar sales: The total sales amount in dollars for all products and services provided by an organization within a given period.
- Contracted revenue: Revenue contracted with customers for a specified period, also referred to as contract value.
- Ordered revenue: Revenue generated from customer purchases, whether under contract or not.
- Delivered revenue: Revenue from products or services delivered to customers, whether under contract or not.
- Invoiced revenue: Revenue that has been invoiced to customers.
- Paid revenue: Revenue that has been invoiced and subsequently paid by customers.
- Percentage of undelivered sales: The proportion of sales that have been ordered but not yet delivered.
- Percentage of revenue not paid: The proportion of invoiced revenue that customers have not yet paid.
- Sales forecast: Projected sales for a future period, based on historical data, seasonal trends, and other influencing factors.
- Number of new contracts: The number of new agreements entered into with customers, ensuring guaranteed revenue.
- Number of current contracts: The number of active contracts at a given time.
- Number of cancelled contracts: The number of contracts terminated during a specific period.
- Number of renewed contracts: The number of contracts that have been renewed, either under the same or modified conditions.
- Number of orders: The total number of orders placed by customers during a specific period.
- Number of pieces per order: The total number of pieces (products, hours) included in an order.
Draw a KPI tree for consistency and tension
A useful tool for solving the KPI puzzle is to draw a so-called KPI tree. This shows the cause-effect relationships between mission, strategic objectives, critical success factors and KPIs. The tree forms a very compact and understandable summary of your organizational strategy.
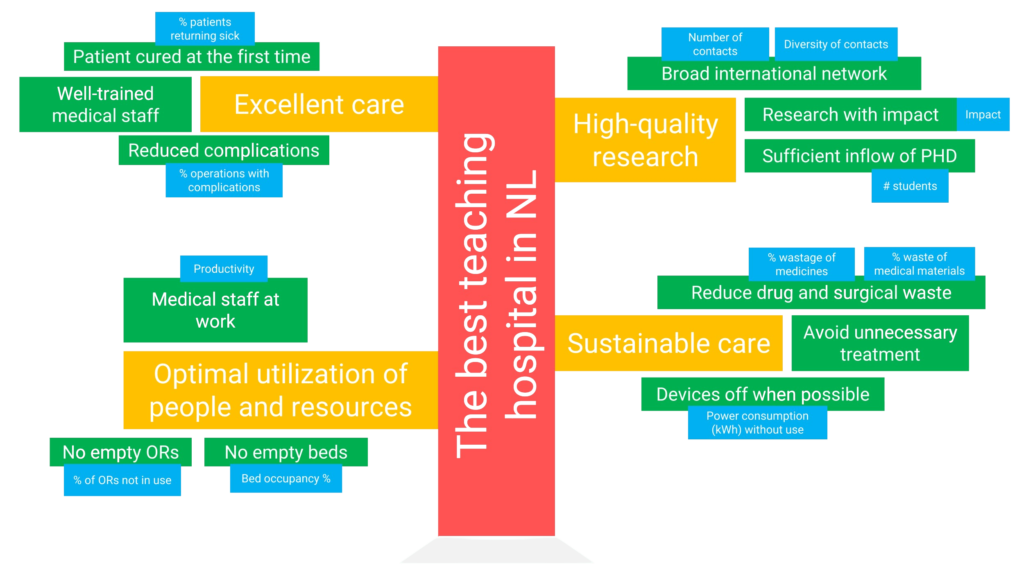 Figure 4: An example of a healthcare KPI tree. This visualization helps you make the essence of your organization and associated governance clear immediately. You translate the mission (red) into strategic goals (yellow), and you translate those into Critical Success Factors (green) and KPIs (blue).
At the same time, you can see how the different KPIs are distributed among the different departments and functions. Thanks to this overview (figure 4), everyone in the organization knows what is really important, where improvements are possible and where the tension is.
Without tension there is no spark of improvement
Moreover, you can use the KPI tree to better justify your investments. For example, if a university hospital strives for high-quality research, it will not only have to attract enough students who want to do a PhD, it may also have to apply for a subsidy in time to purchase that one super-sensitive MRI scanner. Read more after the image.
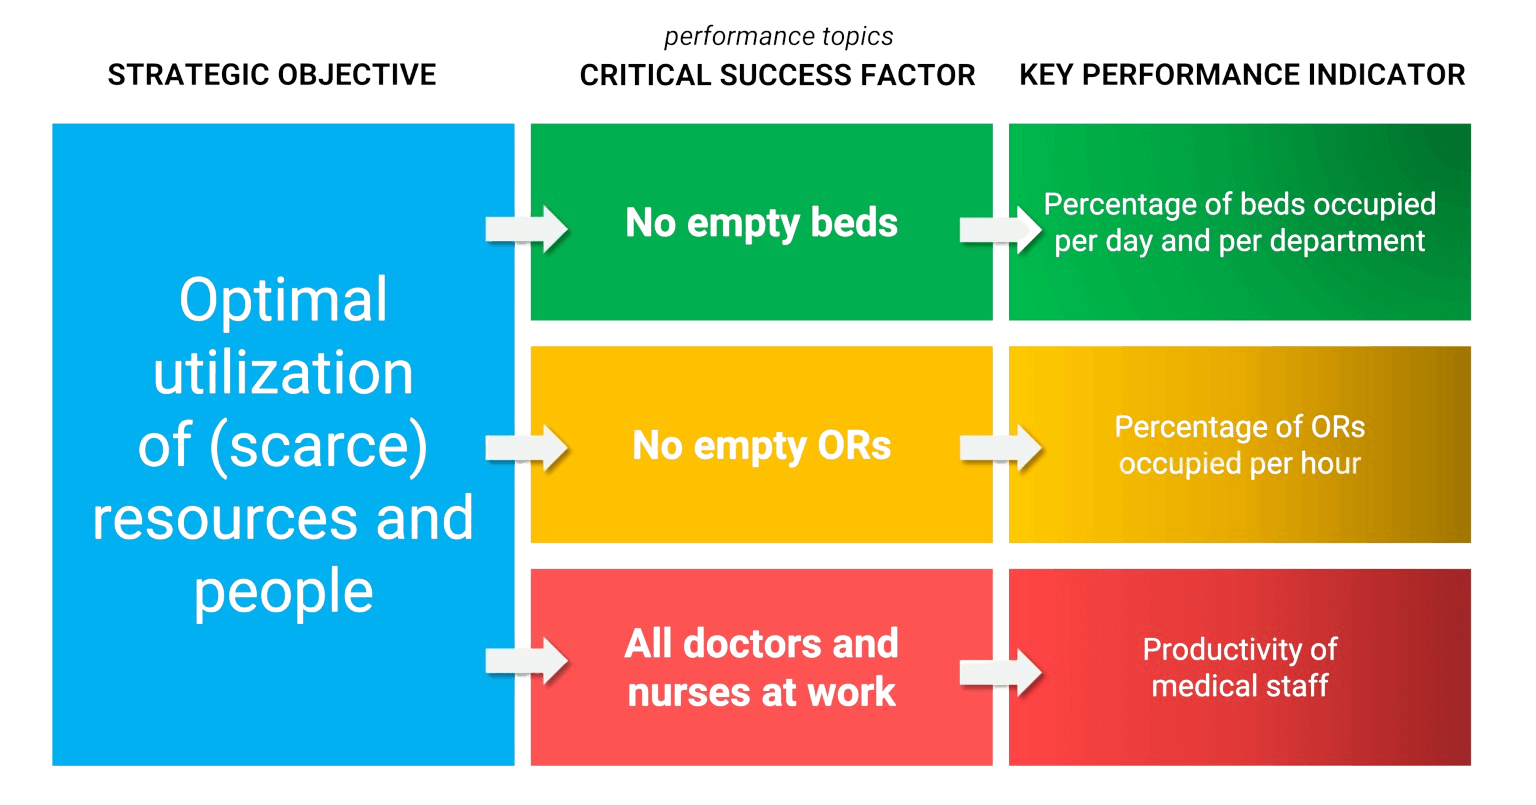 Figure 5: KPI example of a hospital. The extra step between a strategic objective and the Key Performance Indicators is called the Critical Success Factor (CSF).
Next, the operations manager together with his or her staff will have to figure out which KPIs now contribute to an optimal use of scarce people, resources and (expensive) equipment.
The negative formulation of core KPIs
 Earlier we wrote that core KPIs are usually formulated negatively. The main reason is that it is not only simpler and clearer but also works better psychologically and graphically. Simpler because you focus on a few problems, which you can then start solving. So you immediately get the perfect plot to combat waste and implement improvements.
But it is also better psychologically. Think for example of a key performance indicator that measures the percentage of empty shelves at a supermarket, which for a specific store is now 4.5% and you manage to reduce it to 4%. Then you achieve a significant improvement psychologically. If you turn it around and assume full shelves, you achieve a marginal improvement from 95.5% to 96%.
Finally, graphically, negative formulation also offers great advantages. The fluctuations in the graph are more visible because you can maximize the y-axis to the highest value in the range. Of course, it is not forbidden to formulate some KPIs positively if that also works well in your situation.
The 10 biggest problems with KPIs
With over 20 years of experience in KPIs, performance management, and data-driven work, we have identified recurring issues that organizations face with KPIs:
- People often ignore KPIs and continue to follow their “own way”
- The coherence between KPIs is unclear, creating confusion and inefficiency
- KPIs disconnected from strategy miss valuable opportunities
- Too many KPIs, reports, and dashboards create information overload
- Managers use KPIs to evaluate employees, often demotivating them
- Impure definitions spark debates instead of data focus
- Reporting KPIs takes time, limiting data analysis
- KPIs misaligned with decisions and funnels hinder performance improvements
- Weekly and monthly KPI reports often go unread, questioning their effectiveness
- A lack of a performance-oriented culture prevents continuous improvement
As seasoned consultants, we’ve thought deeply about these challenges and developed a practical solution for you. The SMART KPI Guide 2025 dives into these common problems and provides the most effective solutions to address them.
Do you also want KPIs that give meaning? Contact us today
Have the examples and explanations inspired you to create Key Performance Indicators that truly resonate with your employees? Are you ready to take the next step and discuss your ideas with one of our KPI experts? Don’t hesitate—share your thoughts and experiences with us and get in touch directly.
About Passionned Group
![]() Passionned Group is a leading specialist in developing and implementing KPIs, along with everything required to support their effective use. Our experienced KPI experts assist companies, healthcare institutions, and government organizations daily in their journey toward becoming intelligent, data-driven organizations. Every two years, we proudly host the Dutch BI & Data Science Award™.
Passionned Group is a leading specialist in developing and implementing KPIs, along with everything required to support their effective use. Our experienced KPI experts assist companies, healthcare institutions, and government organizations daily in their journey toward becoming intelligent, data-driven organizations. Every two years, we proudly host the Dutch BI & Data Science Award™.
Frequently Asked Questions
What does KPI stand for?
KPI stands for Key Performance Indicator. Read more about “What is a KPI?” here.
Why are KPIs important?
Every professional organization operates through processes and works toward strategic and operational goals. KPIs measure the achievability of these goals and monitor process performance. If goals are too ambitious, you can scale back; if they are too modest, you can accelerate and optimize further. Read more about the 6 most important goals of KPIs here.
What is the difference between a core KPI and a Key Result Indicator?
A Key Result Indicator (KRI) measures broad outcomes such as profitability, customer satisfaction, or employee satisfaction. A core Key Performance Indicator directly influences multiple result areas and can be measured daily. Explore the 4 types of KPIs here.
What is the difference between metrics and KPIs?
Metrics are general data points that track performance, but they are not always tied to critical business goals, such as website traffic or social media followers. KPIs, on the other hand, are specific and strategic metrics that measure progress toward key business objectives, such as increasing monthly sales by 10%. All KPIs are metrics, but not all metrics are considered KPIs, as KPIs are more focused on achieving business goals.
What is the difference between KPI and OKR?
KPIs are specific metrics used to track performance against established goals, often focused on ongoing operations. OKRs (Objectives and Key Results) are a goal-setting framework combining a qualitative objective with measurable key results. They are typically broader and more aspirational, designed to drive strategic progress. For example, an objective might be “Expand market presence,” with key results like “Launch in three new regions” or “Grow customer base by 20%.”
Can you express a core KPI in financial terms?
No, core KPIs are never financial in nature. They drive future financial outcomes rather than representing them directly.
What does a KPI measure?
A KPI measures how well a process is performing and highlights what is happening within that process. It can also be used to monitor progress toward (strategic) objectives.
What criteria must a KPI meet?
KPIs, along with their target values, should adhere to the SMART principle. They must be Specific, Measurable, Acceptable, Realistic, and Time-bound.
What is an example of a SMART KPI?
An example of a SMART KPI is “Increase website traffic by 25% within the next six months through SEO improvements”. Order our SMART KPI guide to see 750 SMART KPI examples.
What is the most common KPI?
The most common KPI depends on the industry and business goals, but some universally popular KPIs include customer retention rate, conversion rate, and employee productivity. In our SMART KPI guide you can find other examples.
How many KPIs do I need to manage effectively?
The ideal number of KPIs depends on your organization’s size, complexity, and strategic objectives. For a medium-sized company, an experienced manager can often manage effectively with three to five KPIs per objective.
How to set KPIs?
To set KPIs, identify the relevant indicators, define their formulas, and specify the data needed for calculation. Have these definitions reviewed by key stakeholders like management and IT, process their feedback, and document the KPIs in an accessible format. Use available data to calculate scores, discuss results with users, and refine the KPIs as needed. Once finalized, you can use them to drive decision-making effectively. Read the 9 steps here.