Independent information about Tableau Server, Tableau Desktop, and Tableau Prep Conductor
In this focus article, we present a critical overview of our objective BI & Analytics survey of the software vendor Tableau and its product portfolio (such as Tableau Server, Tableau Desktop, and Tableau Prep Conductor). Tableau BI & Analytics scores better in our survey than MicroStrategy but slightly worse than Oracle. Of all the categories in our research, Tableau scored the best in self-service BI and does not have a strong focus on artificial intelligence. Within the context of BI & Analytics, we have put together the main advantages and disadvantages of Tableau Business Intelligence, and arranged them by topic (business intelligence, big data, artificial intelligence, and Data Science). We also point out the features of the product portfolio such as Tableau Server, Tableau Desktop, and Tableau Prep Conductor et cetera.
How does Tableau BI & Analytics score on certain components?
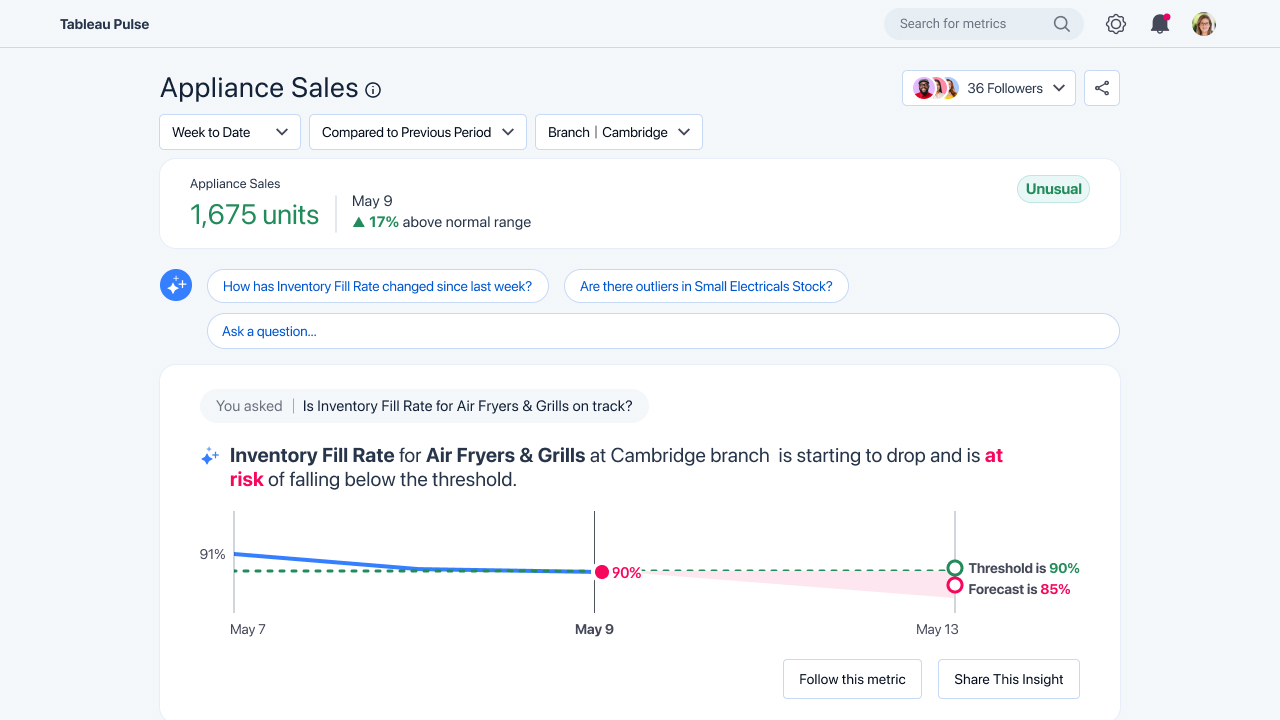
In our study, we also investigated the various software products of Tableau software. More than 720 criteria were used in the process. The figure below illustrates the strengths and weaknesses of Tableau Business Intelligence, compared to key competitors. Please note that Passionned Group is 100% independent of the suppliers in our guide. We are not a reseller, we do not make deals or have any ties to the vendor. Among other things, we help and advise companies in the proper selection of BI tooling.
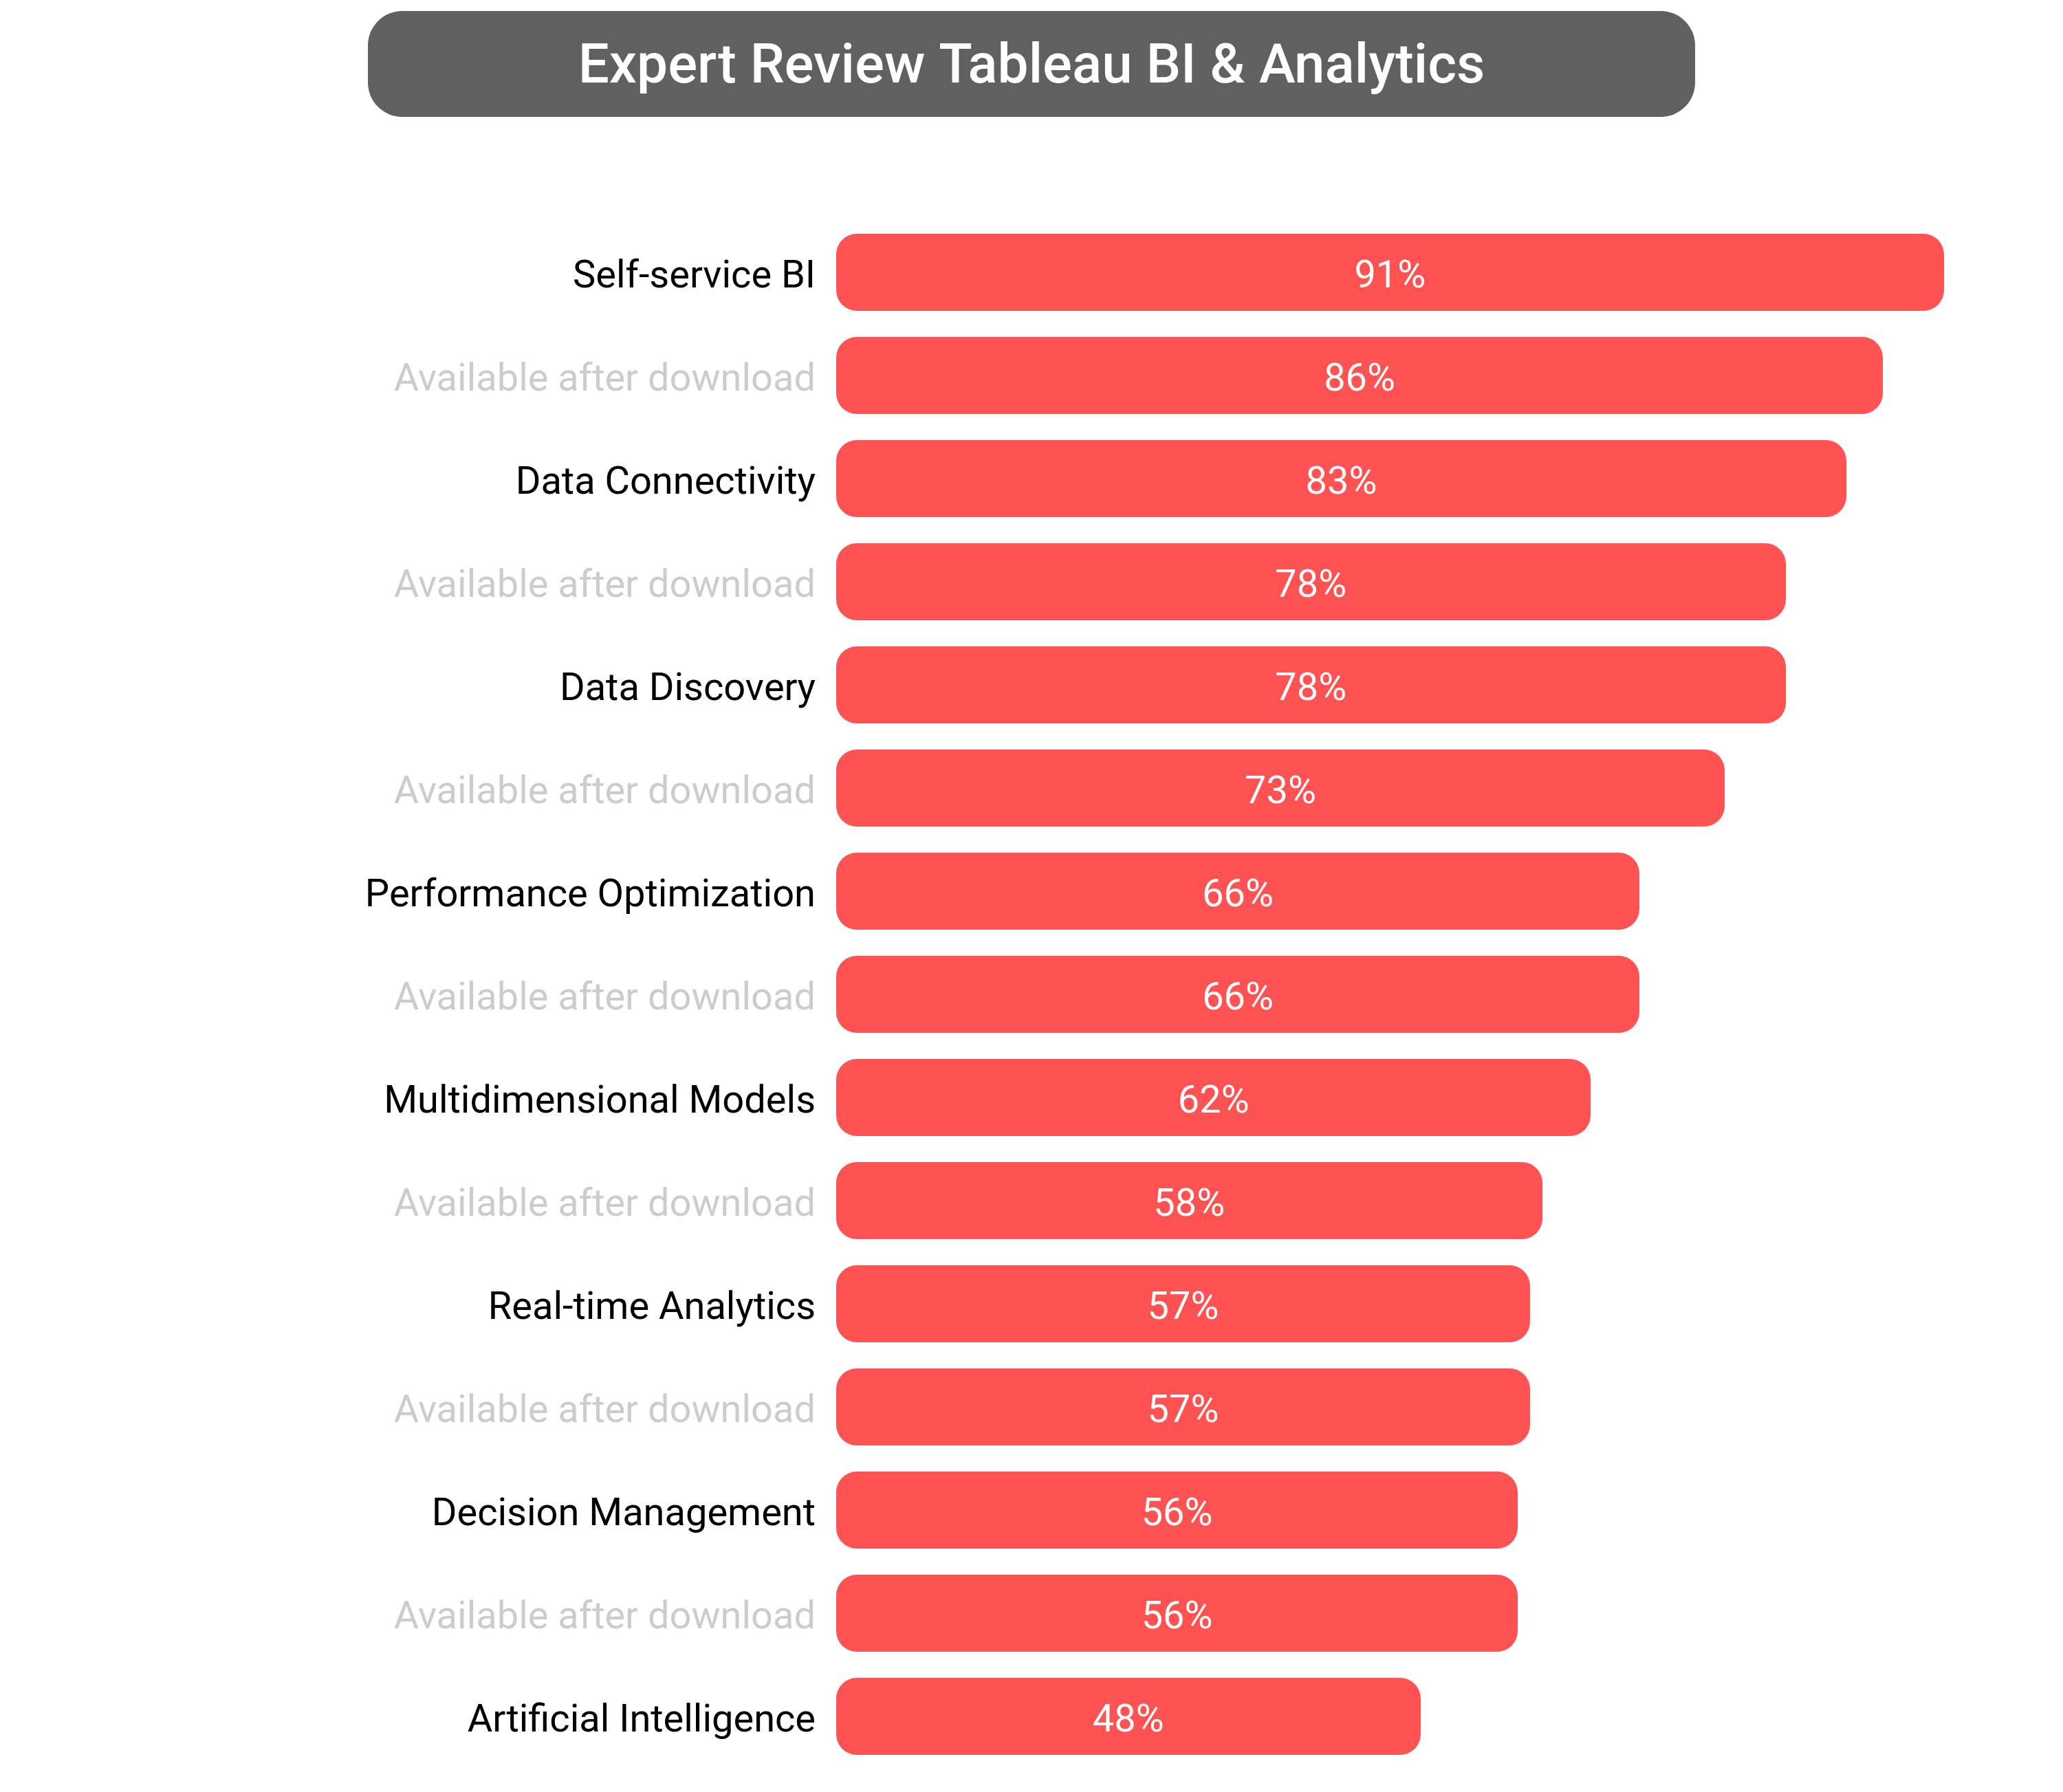 Figure 1: Strength-weakness analysis of the supplier Tableau BI & Analytics. A vendor can score a maximum of 100%. Source: The BI & Analytics Guide 2026. Do you want more information about our research design? Click here to download this guide.
The Tableau analysis was compiled by intercepting big data and from there it was extensively analyzed. More than 8,169 documents were reviewed (since the inception of this research) from this vendor. In this analysis process, both algorithms as a senior expert played an important role in performing the validation.The BI & Analytics Guide™ 2026  In our 100% vendor-independent BI & Analytics Guide we have collected all the ins and outs of Tableau for you. You get access to hundreds of (shorter) trainings, tech talks, lectures, demos, tutorials, and so on and always have the latest BI & AI news. This mini-course also assists you in deepening your knowledge about BI & Analytics.
Tableau and their complete BI & Analytics product portfolio
Tableau carries (a minimum of) 24 products in the realm of BI & Analytics. Based on relevance we list the products of Tableau below:
What is Tableau Business Intelligence?
Other names by which this software product is known: Tableau Analytics
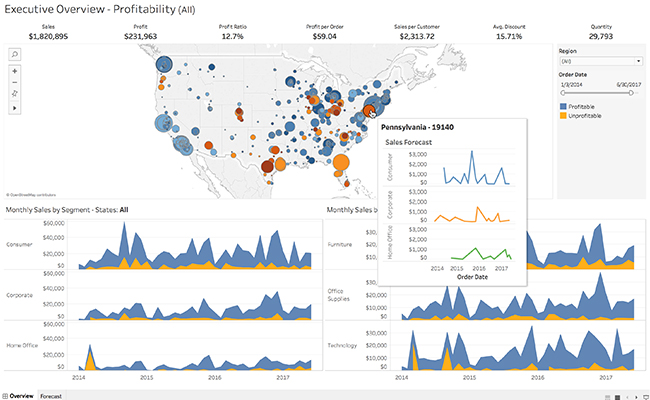
In this section, we report the (main) characteristics of Tableau Business Intelligence, including some of its features and any related products. This product group consists of Tableau Server, Tableau Desktop, Tableau Prep Conductor, Tableau Online, Tableau Public, Tableau Prep Builder, Tableau Cloud, Hyper API, Tableau Bridge, Tableau Data Management, Tableau Reader, Tableau Hyper, Tableau Embedded Analytics, Tableau Mobile, Ask Data, Tableau Advanced Analytics, Tableau In-memory Data Engine, Tableau Predictive Analytics, Tableau GPT, and Tableau Pulse. The product Tableau Business Intelligence can be characterized by the following features:
- analysis
- analytics
- analytics platform
- business intelligence
- dashboards
- data mining
- data visualization
- infrastructure
- reporting
- Salesforce
Do you want to know the intricacies of all elements (100+) of Tableau Business Intelligence? Then download our BI & Analytics Guide™ 2026 here.
Do you want to hire an experienced Tableau Business Intelligence specialist?
Are you considering hiring an external consultant specialized in Tableau Business Intelligence who can do a mountain of work for you, and implement a beautiful Tableau Business Intelligence application? You can do so using our interim services. Indeed, hiring Tableau Business Intelligence developers is not always necessary and sometimes even inconvenient. Leave a message here and we’ll get back to you quickly.
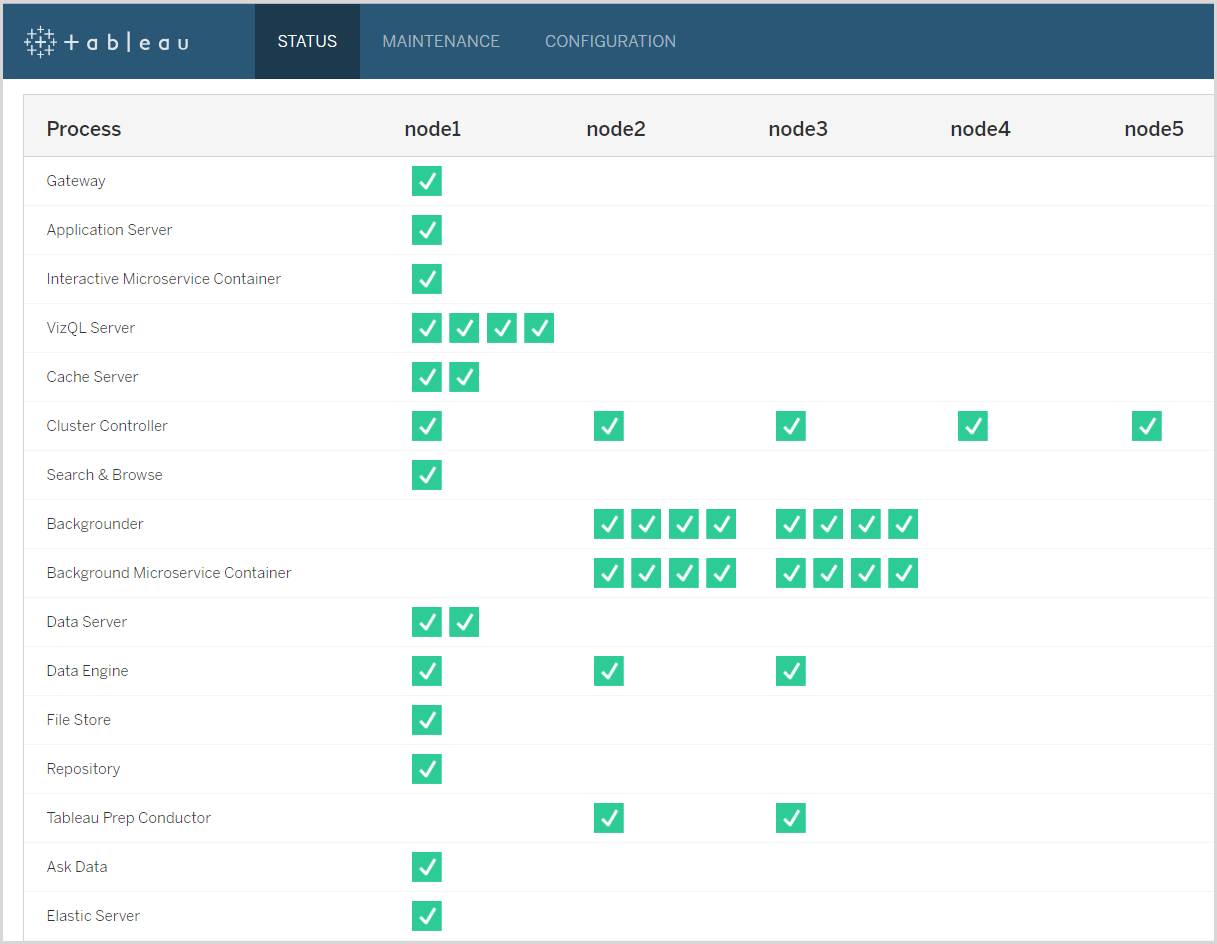
What is Tableau Server?
We don’t reveal everything here but, in this paragraph, we portrait Tableau Server, including some of its features and any related products. This product group consists of Tableau Server Management Add-on and Tableau Server REST API. This product/group of products can be defined by the following features:
- analysis
- analytics
- dashboards
- data integration
- data visualization
- embedded analytics
- high availability
- interactive dashboards
- SaaS
- Windows
Are you curious about all elements (100+) of Tableau Server? In that case, open the BI & Analytics Guide™ 2026 here.
What is Tableau Server Management Add-on?
Under this heading, we provide a description of Tableau Server Management Add-on, including some of its features and any related products. Tableau Server Management Add-on can be best defined by the following features:
- Amazon Web Services
- analytics
- business intelligence
- data management
- data visualization
- Linux
- SaaS
- scalability
- web services
- Windows
Are you curious about all the functionalities (100+) of Tableau Server Management Add-on? Download directly our BI & Analytics Guide™ 2026 here.
What is Tableau Server REST API?
In this paragraph, we portrait Tableau Server REST API, including some of its features and any related products. This product/group of products can be characterized by the following functionalities:
- active directory
- Application Programming Interface
- authentication
- java
- JSON
- native
- open source
- Python
- repository
- SQL
Do you want to know everything about all elements (100+) of Tableau Server REST API? Download the BI & Analytics Guide™ 2026 here.
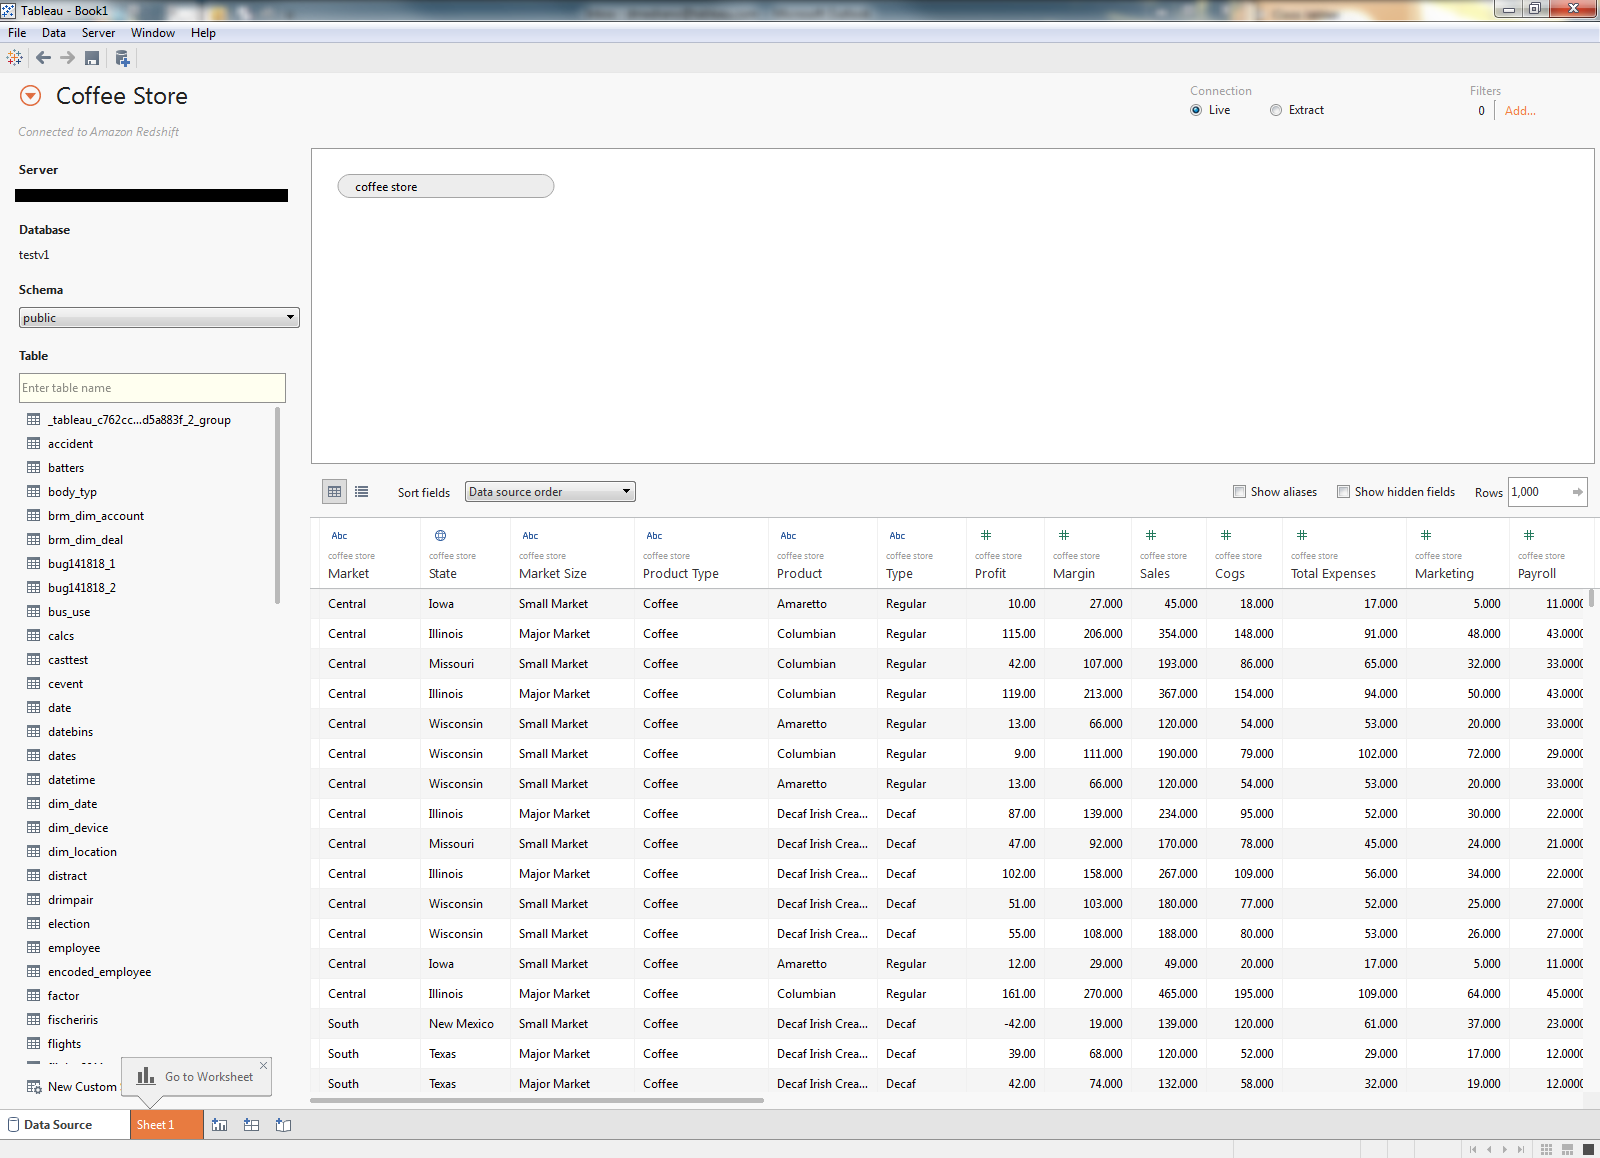
What is Tableau Desktop?
Under this heading, we report the (main) characteristics of Tableau Desktop, including some of its features and any related products. This product/group of products can be best defined by the following characteristics:
- analytics
- analytics platform
- dashboards
- data visualization
- real-time
- repository
- Salesforce
- self-service analytics platform
- Windows
Are you curious about all characteristics (100+) of Tableau Desktop? Download directly our BI & Analytics Guide™ 2026 here.
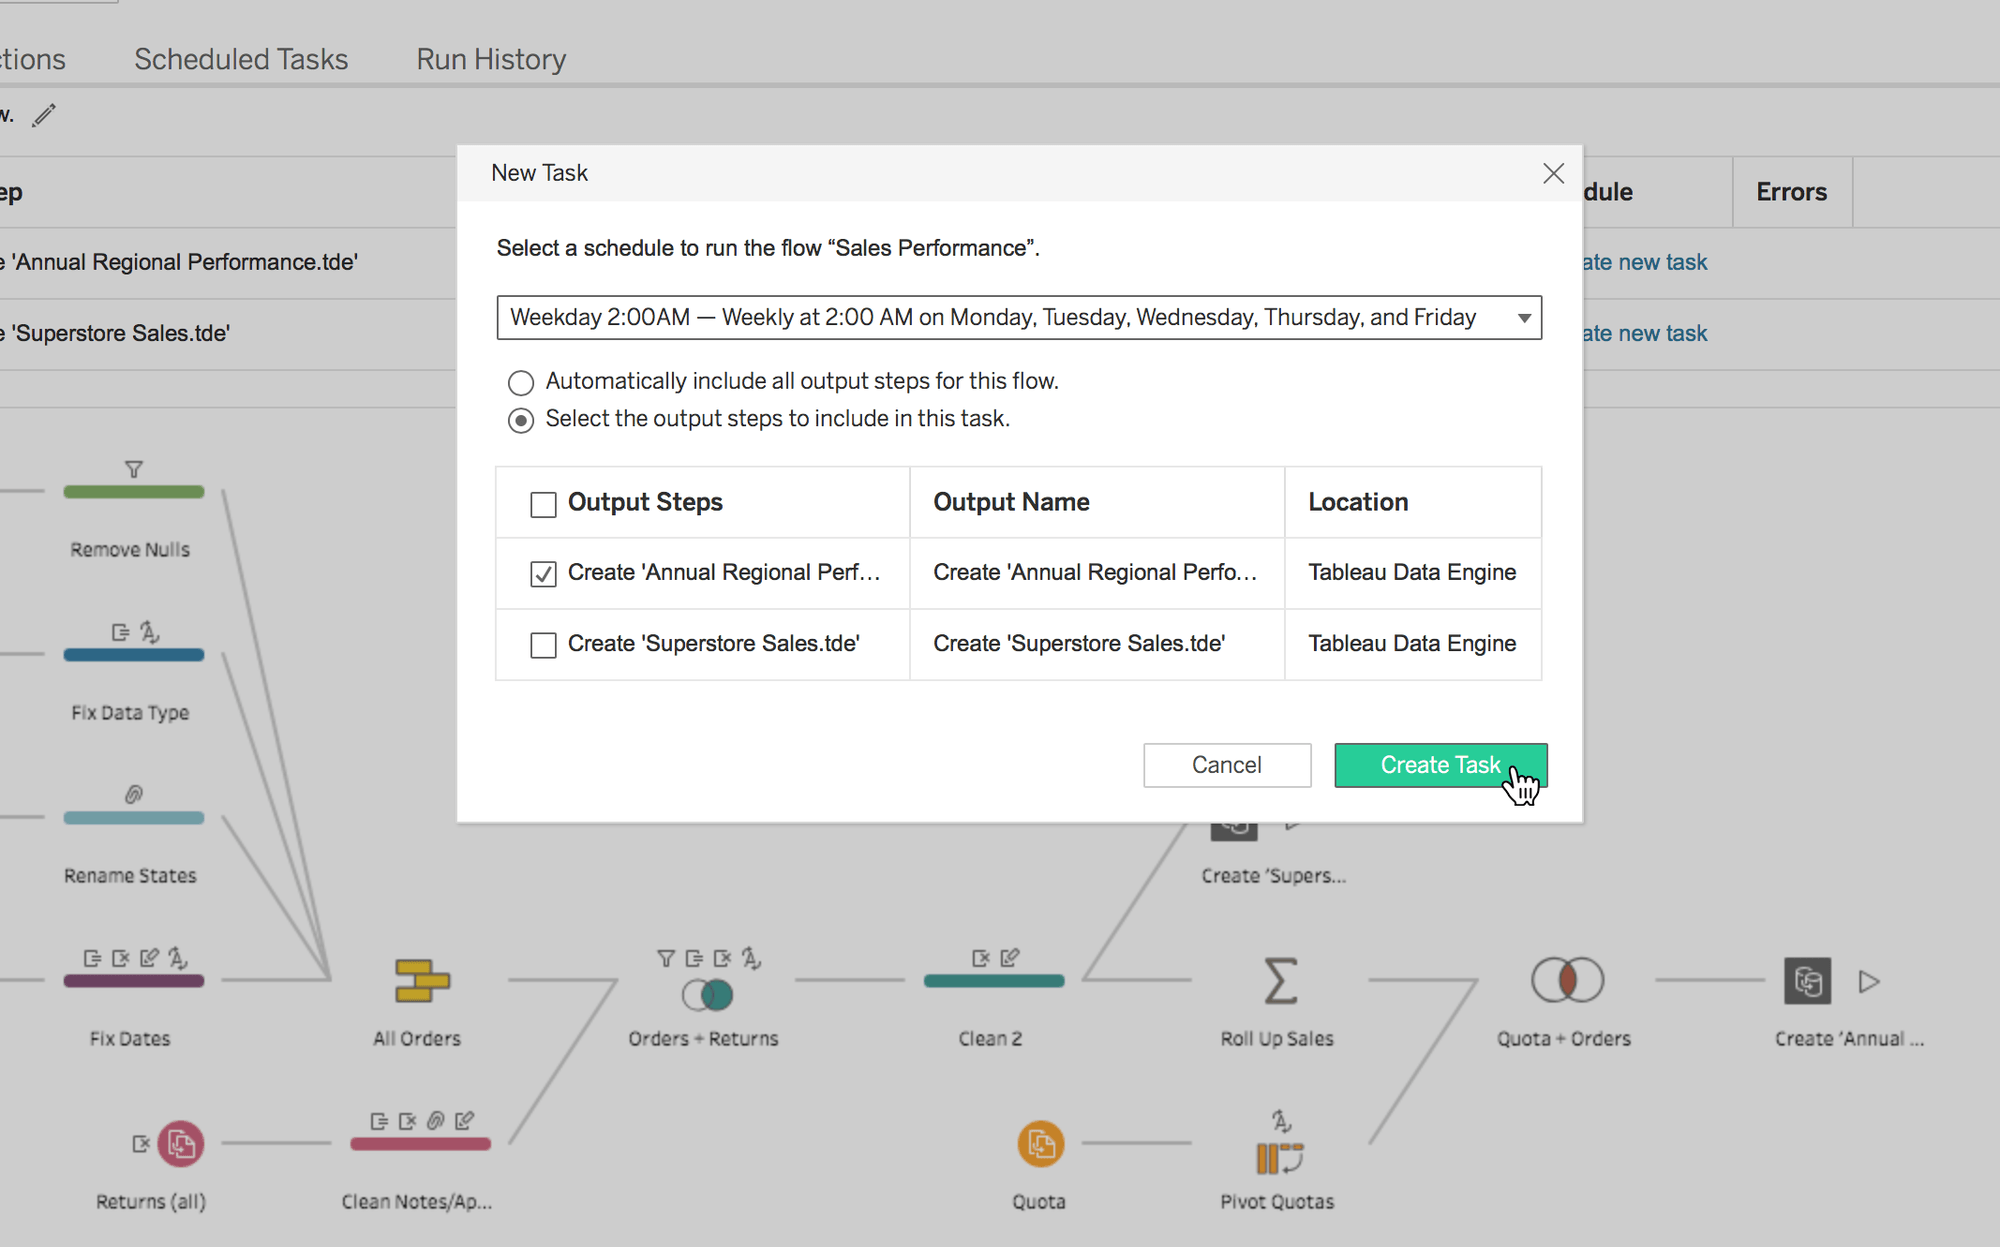
What is Tableau Prep Conductor?
Other names by which this software product is known: Prep Conductor, Tableau Prep
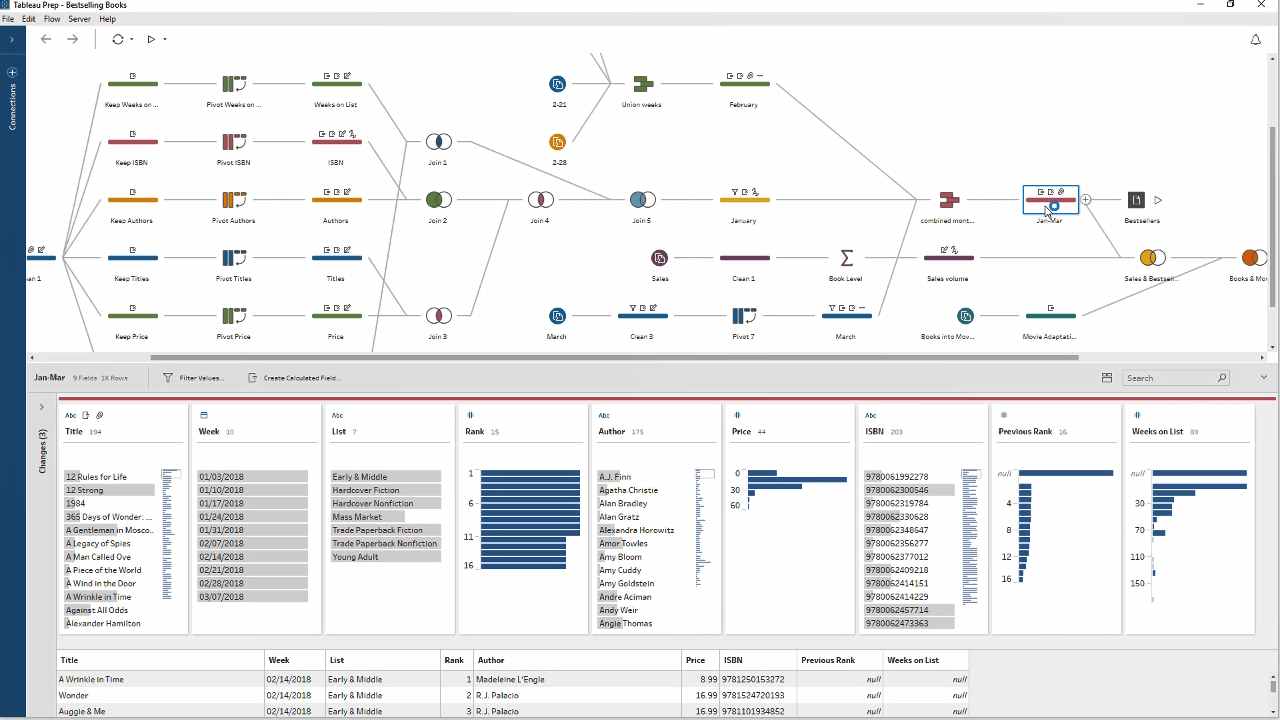
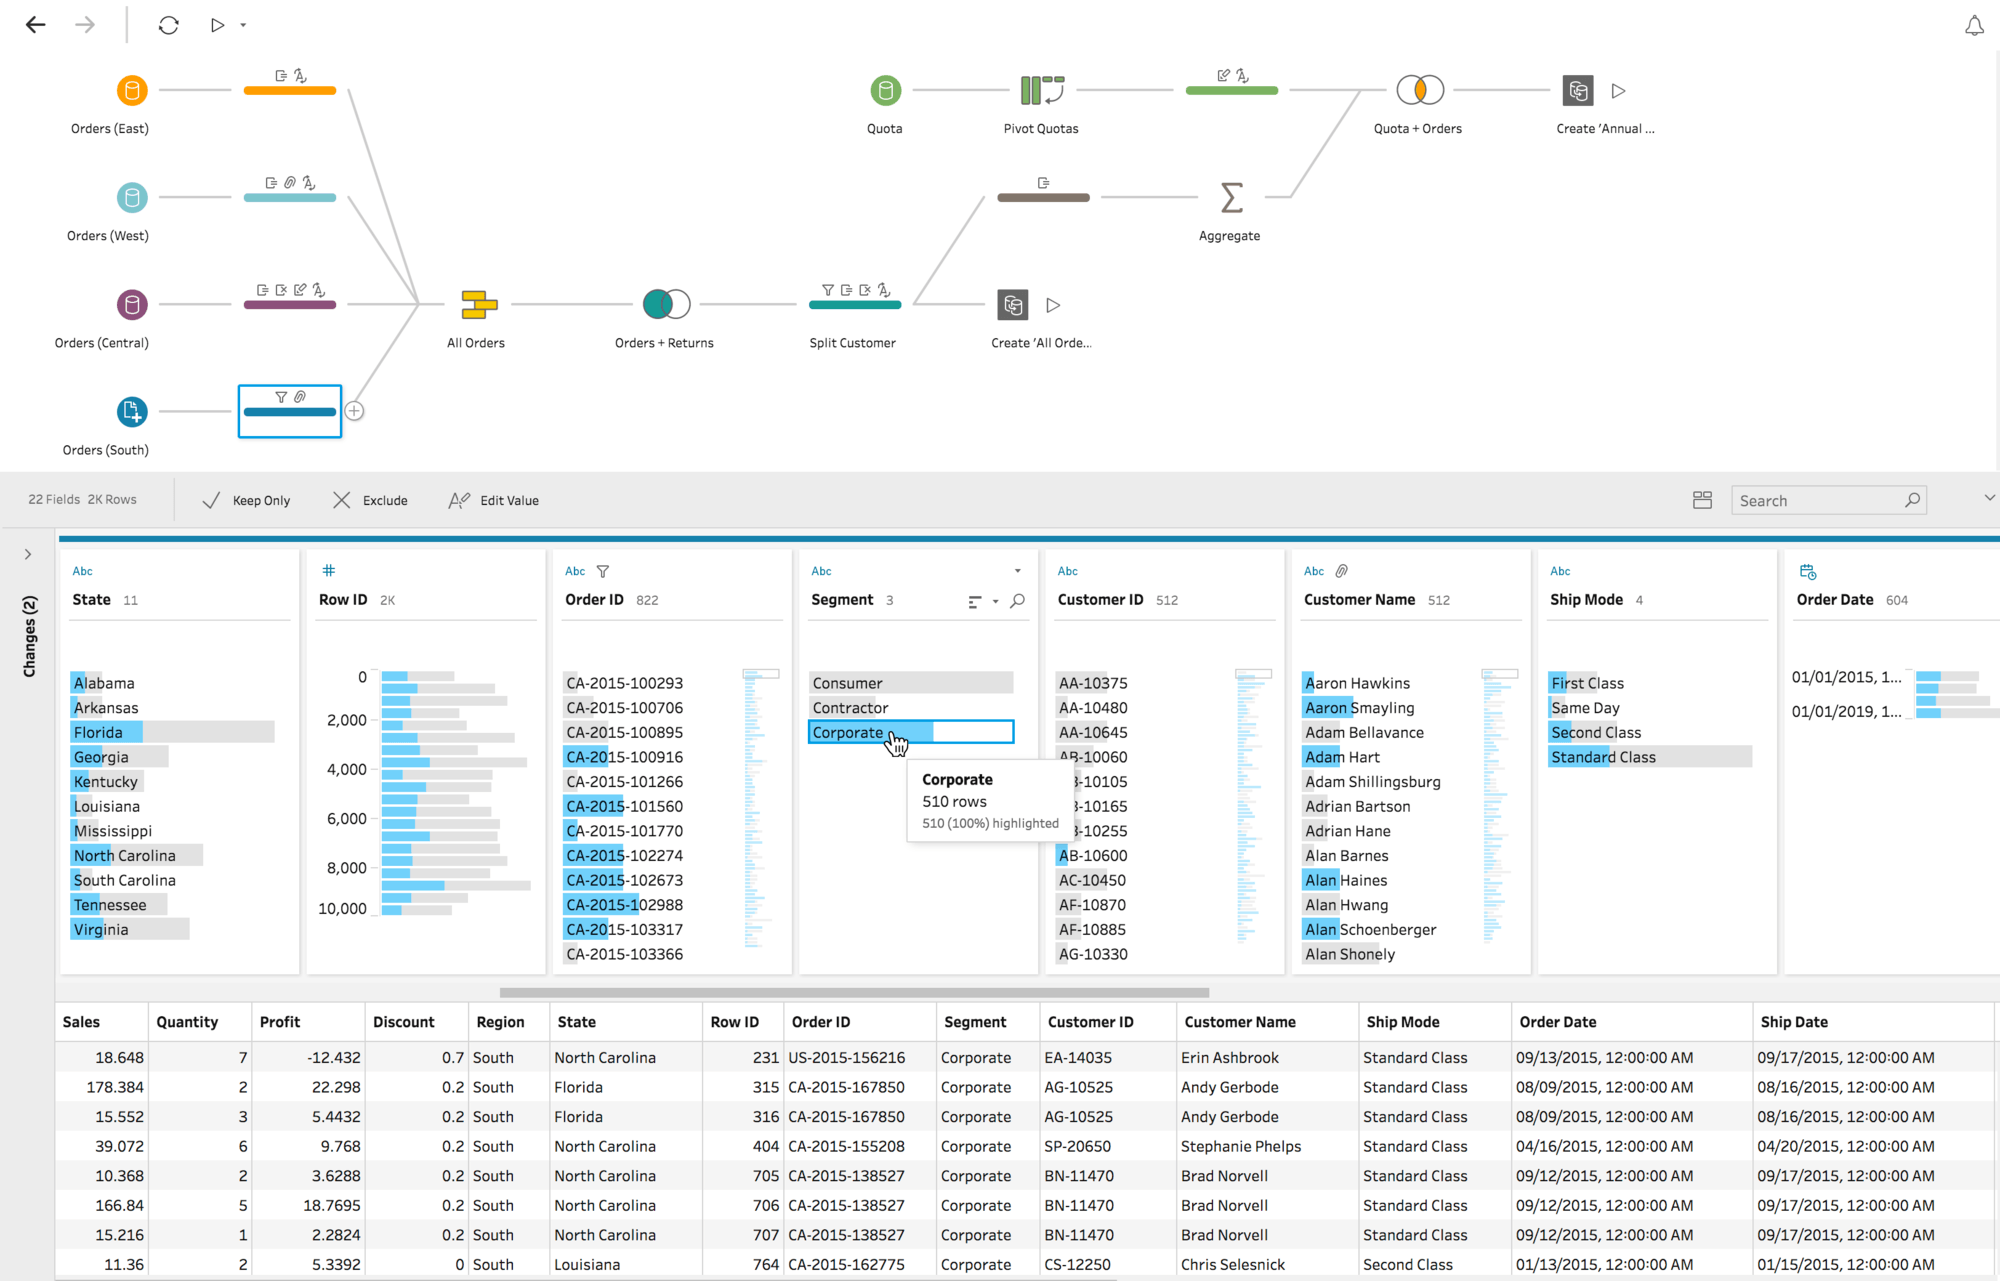
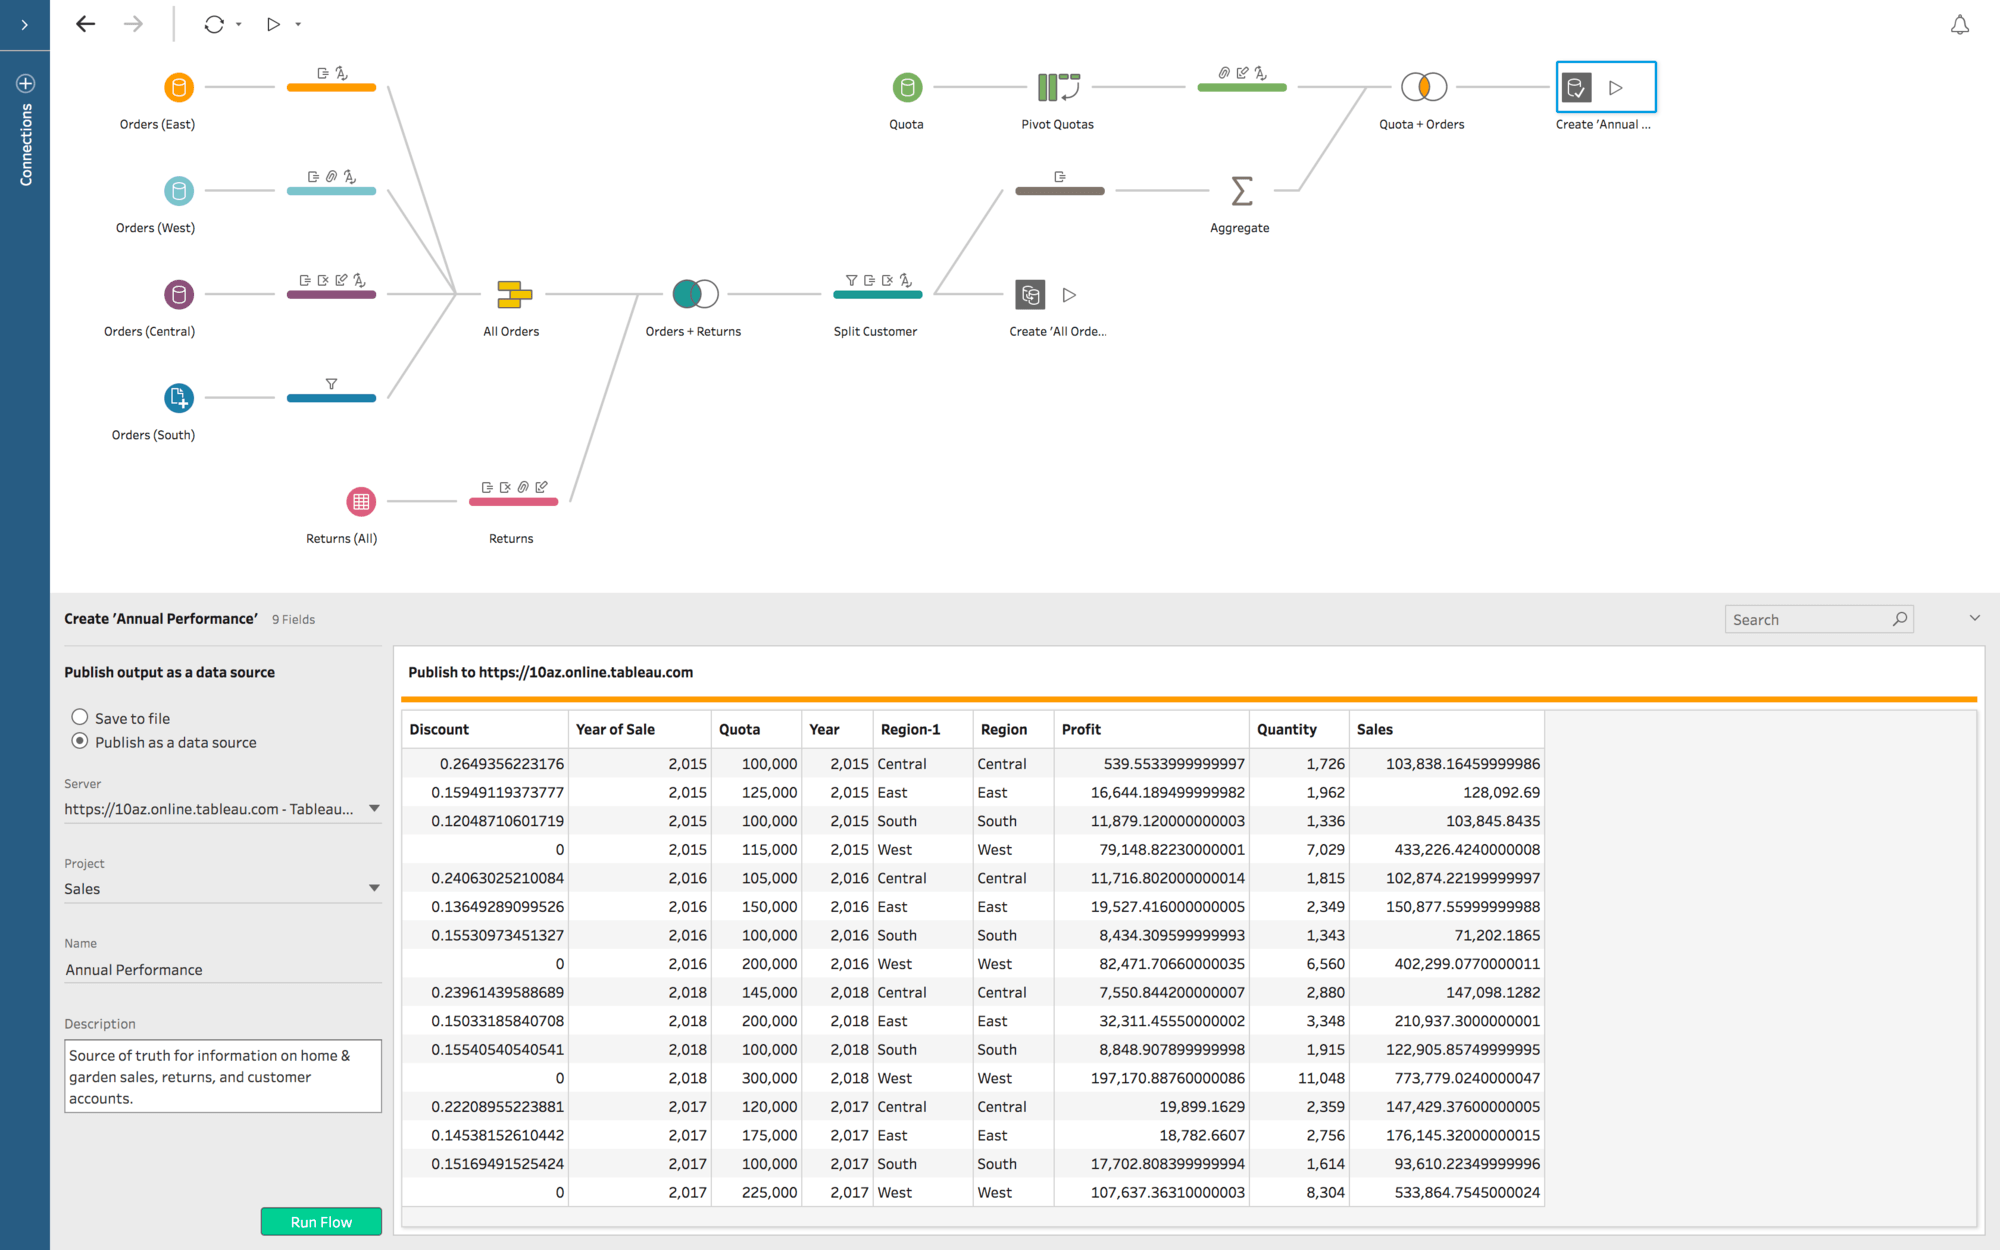
Under this heading, we describe Tableau Prep Conductor, including some of its features and any related products. This product/group of products can be best defined by the following functionalities:
- analysis
- authentication
- dashboards
- data catalog
- data management
- data preparation
- multi-factor authentication
- notifications
- Salesforce
- self-service data preparation
Are you now curious about all properties (100+) of Tableau Prep Conductor? In that case, open the BI & Analytics Guide™ 2026 here.
What is Tableau Online?
In this section, we provide a description of Tableau Online, including some of its features and any related products. This product/group of products can be best characterized by the following features:
- analytics
- business intelligence
- cloud based
- dashboards
- data management
- data visualization
- interactive data visualizations
- SaaS
- Salesforce
- share insights
Do you want to know the intricacies of all characteristics (100+) of Tableau Online? Then download our BI & Analytics Guide™ 2026 here.
What is Tableau Public?
In this paragraph, we report the (main) characteristics of Tableau Public, including some of its features and any related products. This product can be defined by the following features:
- analysis
- analytics
- business intelligence
- dashboards
- data visualization
- infrastructure
- interactive dashboards
- iOS
- repository
Do you want to know everything about all elements (100+) of Tableau Public? Then download our BI & Analytics Guide™ 2026 here.
What is Tableau Prep Builder?
We don’t reveal everything here but, in this paragraph, we provide a description of Tableau Prep Builder, including some of its features and any related products. The tool Tableau Prep Builder can be best characterized by the following features:
- active directory
- analysis
- CSV
- data management
- data preparation
- repository
- Salesforce
- spatial data
- Windows
Are you now curious about all the functionalities (100+) of Tableau Prep Builder? Download the BI & Analytics Guide™ 2026 here.
What is Tableau Cloud?
In this paragraph, we provide a description of Tableau Cloud, including some of its features and any related products. The product Tableau Cloud can be best characterized by the following characteristics:
- analytics
- analytics platform
- authentication
- business intelligence
- dashboards
- data management
- infrastructure
- multi-factor authentication
- Red Hat
- SaaS
Are you curious about all the functionalities (100+) of Tableau Cloud? Then order the BI & Analytics Guide™ 2026 here.
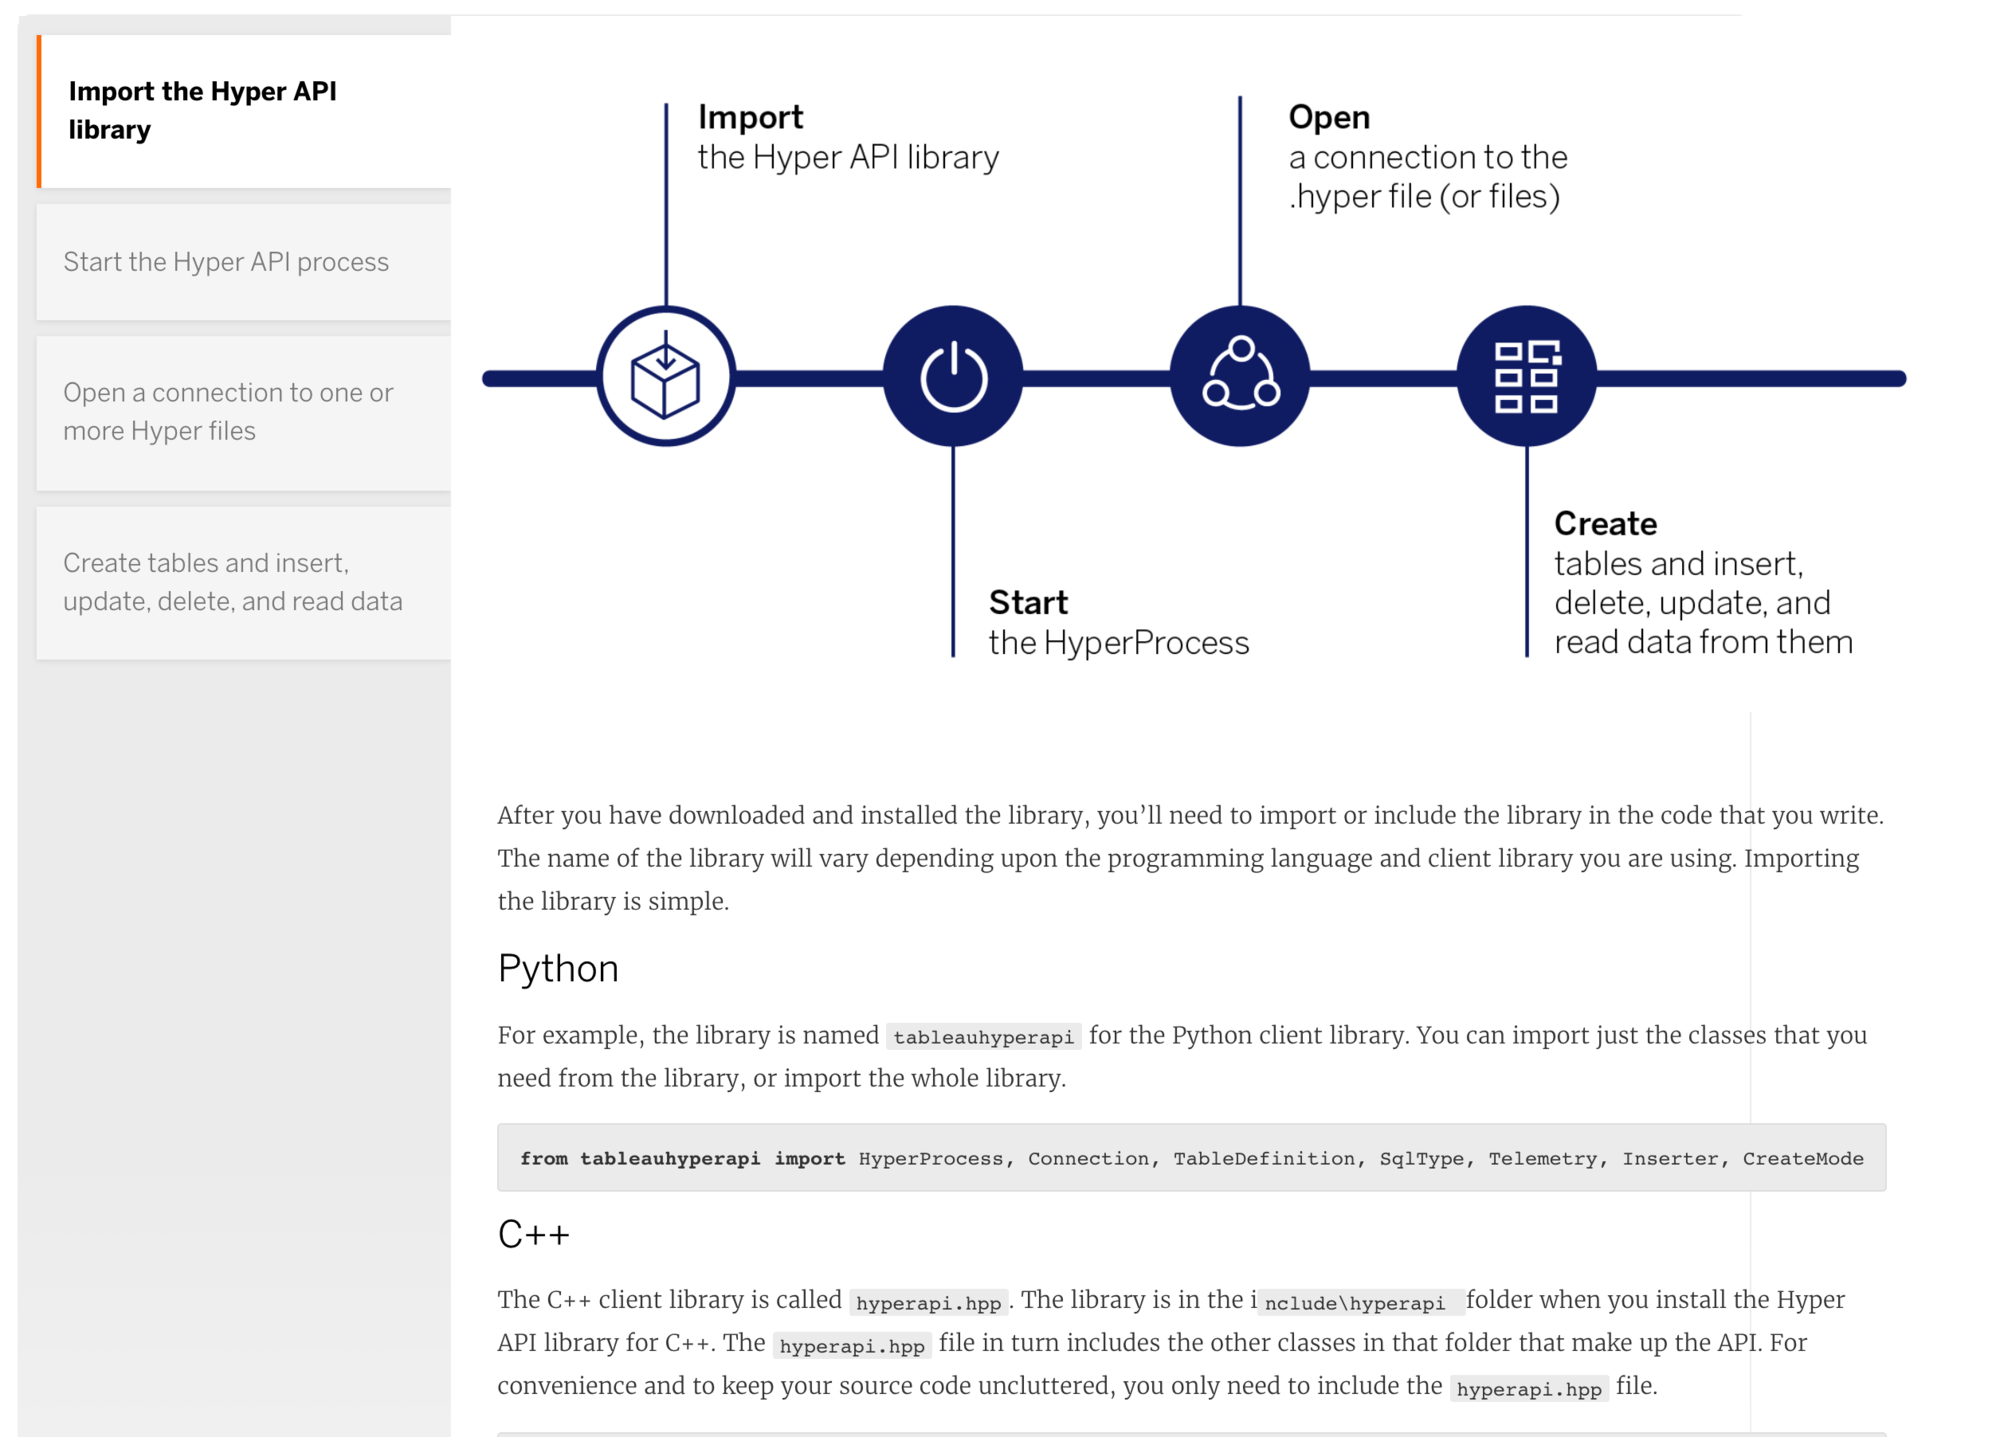
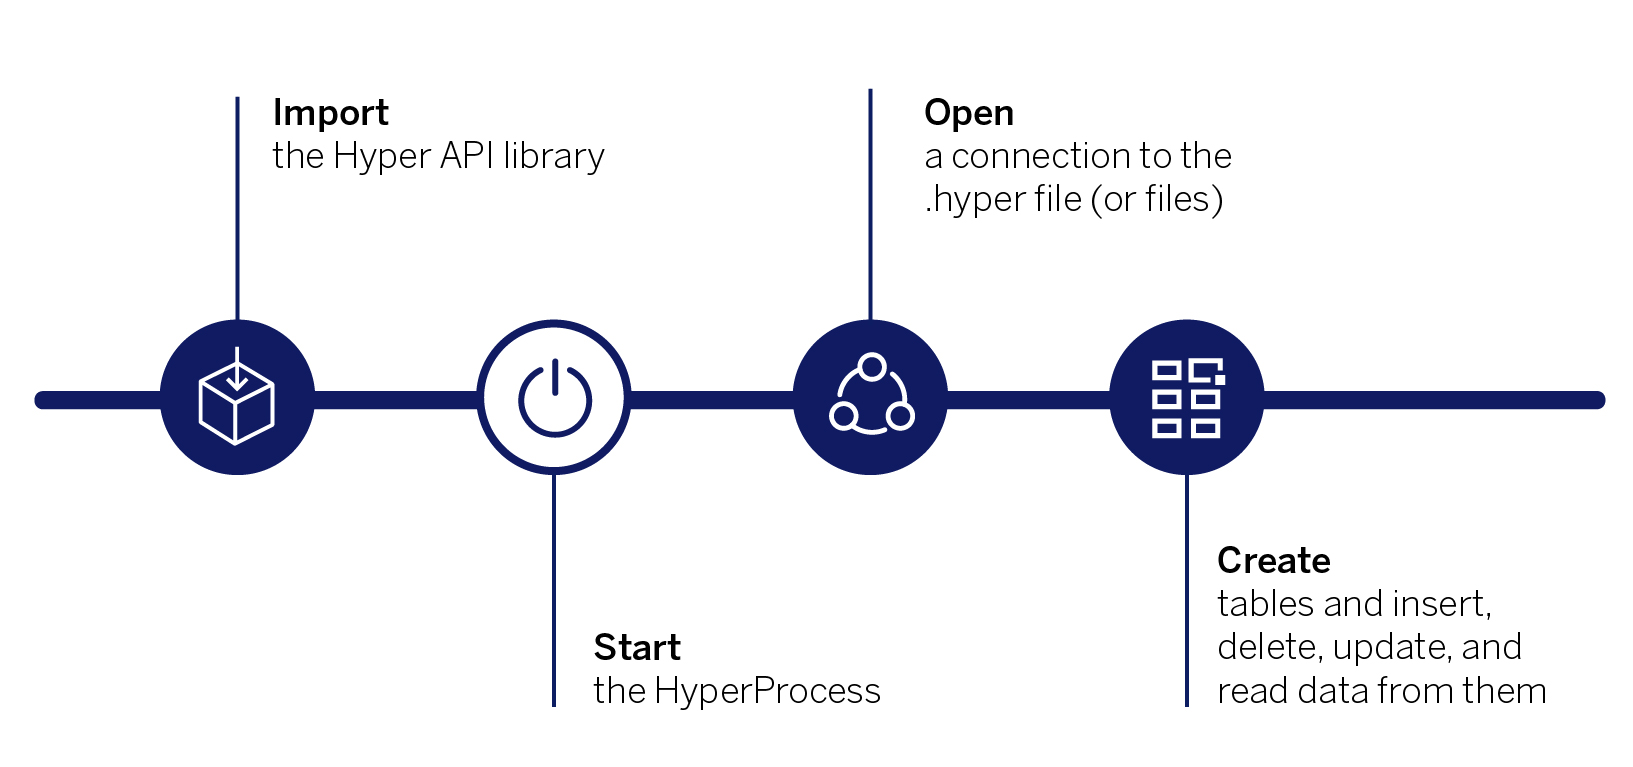
What is Hyper API?
In this paragraph, we provide a description of Hyper API, including some of its features and any related products. Hyper API can be best characterized by the following functionalities:
- advanced analytics
- analytics
- CSV
- data connectivity
- java
- native
- Python
- SQL
- SQL database
- Windows
Are you now curious about all properties (100+) of Hyper API? Open the BI & Analytics Guide™ 2026 here.
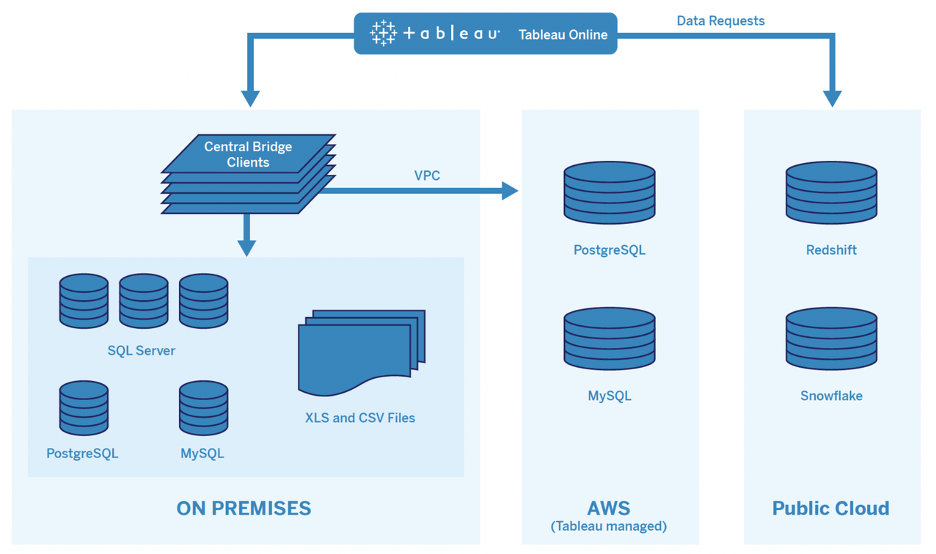
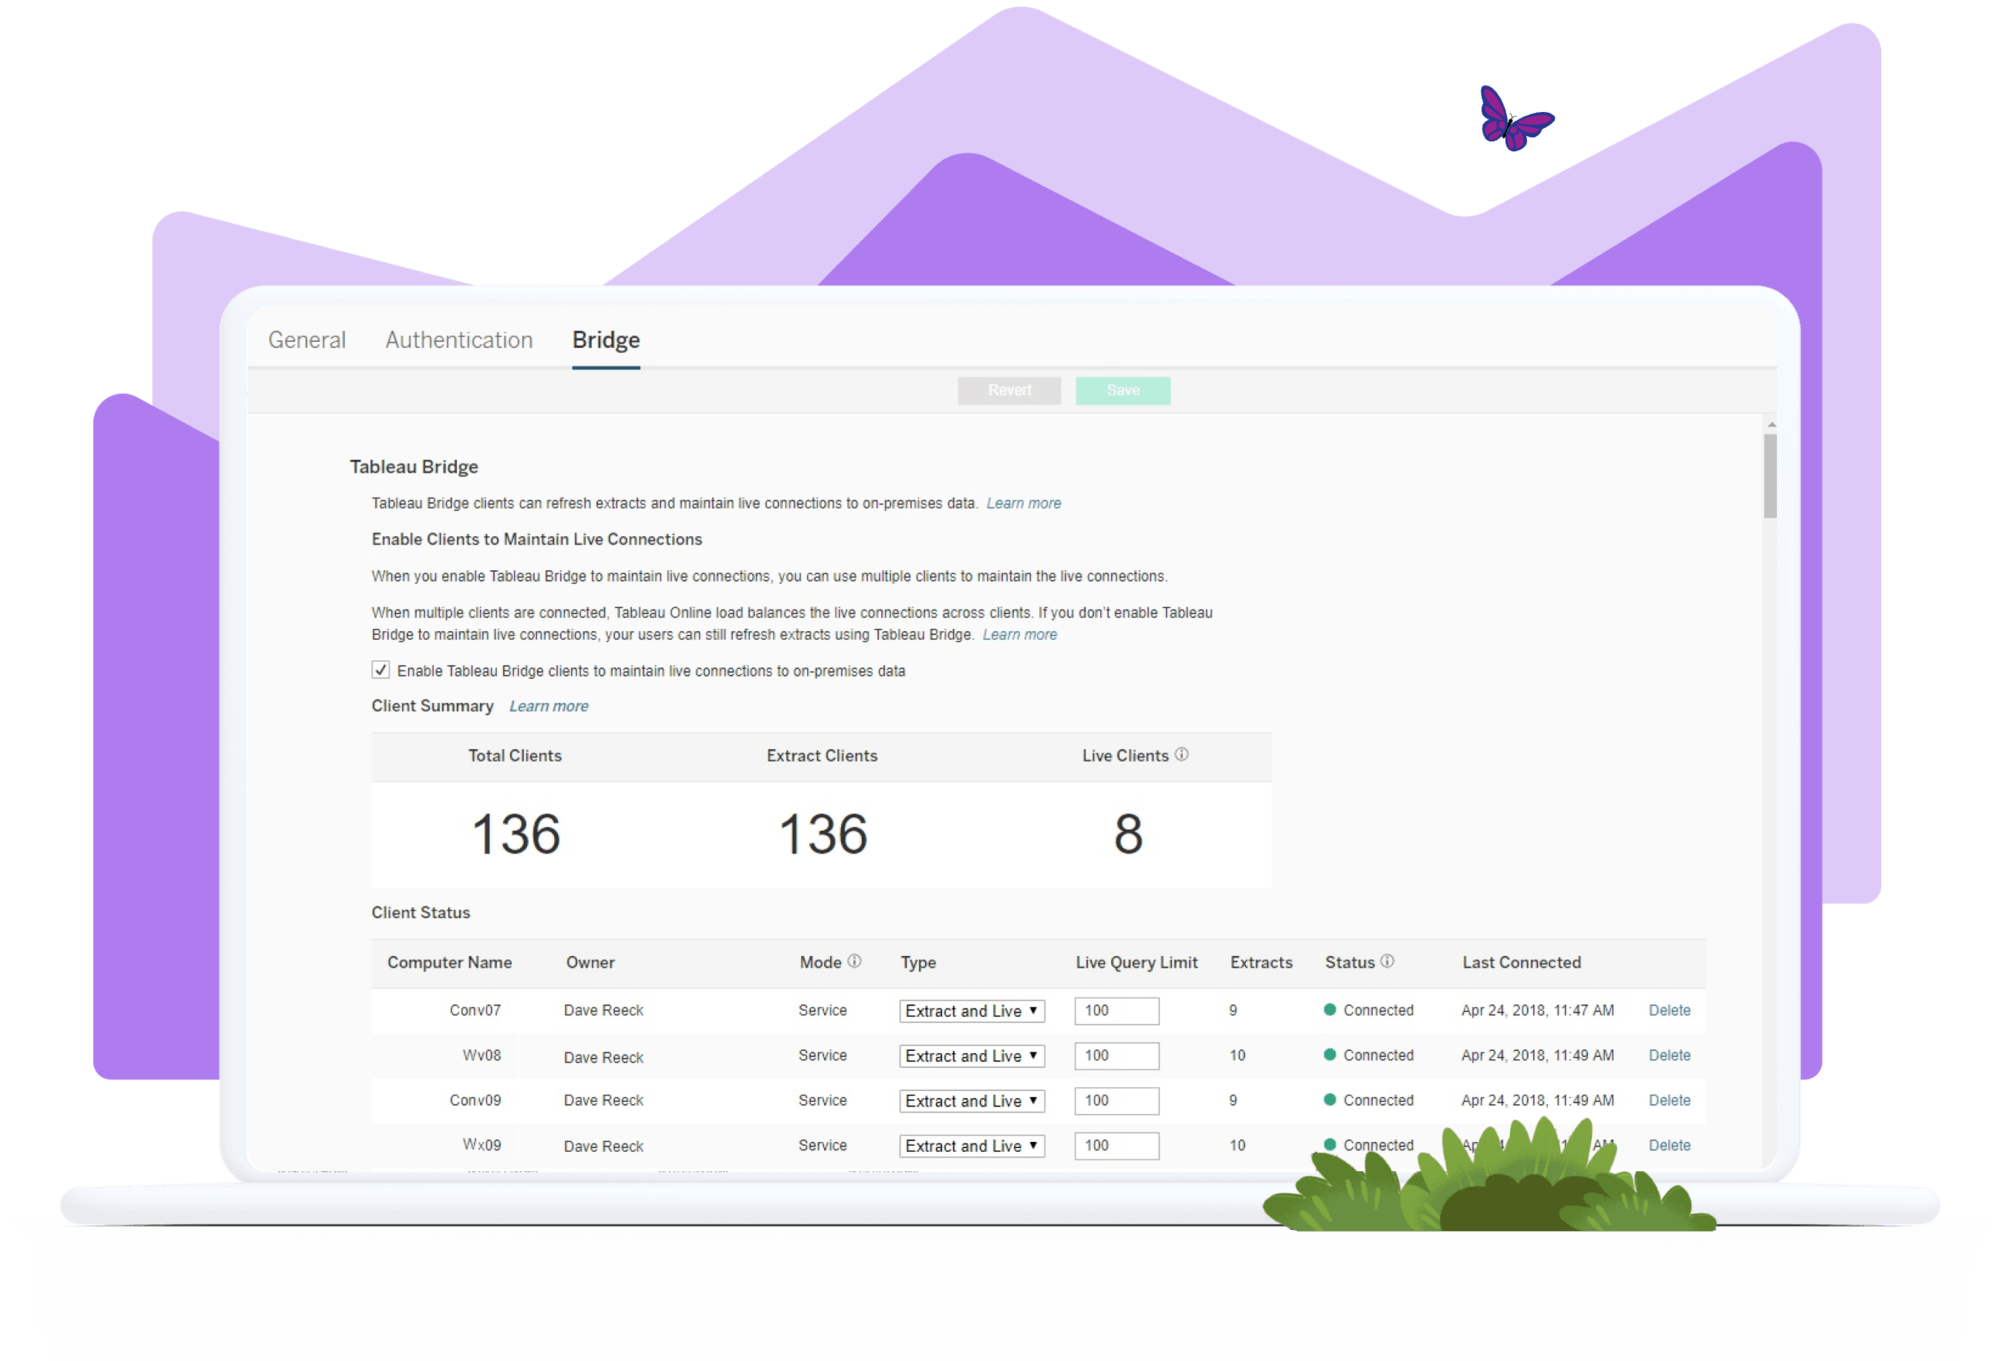
What is Tableau Bridge?
In this paragraph, we provide a description of Tableau Bridge, including some of its features and any related products. This product can be best characterized by the following properties:
- analytics
- connectivity
- data connectivity
- Google BigQuery
- live connection
- OAuth
- real-time
- Salesforce
- SQL
- Windows
Do you want to know the intricacies of all features (100+) of Tableau Bridge? In that case, order the BI & Analytics Guide™ 2026 here.
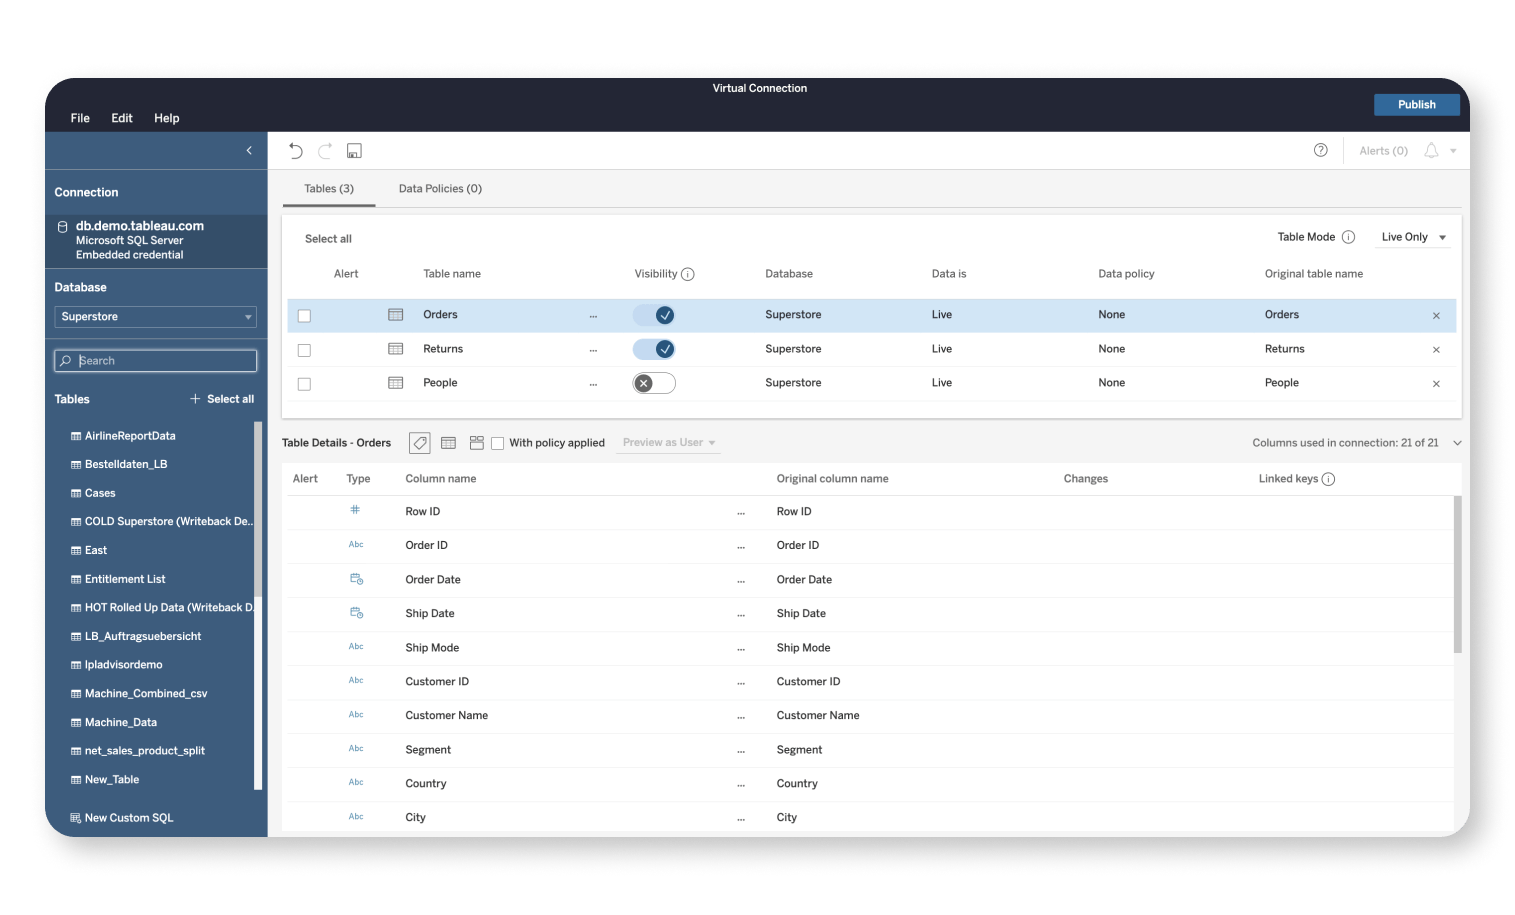
What is Tableau Data Management?
In this paragraph, we describe the key elements of Tableau Data Management, including some of its features and any related products. This product group consists of Tableau Data Management Add-on. This product can be characterized by the following characteristics:
- analysis
- analytics
- data management
- data preparation
- data quality
- data quality warnings
- impact analysis
- lineage feature
- Salesforce
- visual storytelling
Do you want to know the intricacies of all the functions (100+) of Tableau Data Management? Download the BI & Analytics Guide™ 2026 here.
What is Tableau Data Management Add-on?
We do not display all the features here but, in this paragraph, we display the details of Tableau Data Management Add-on, including some of its features and any related products. This product/group of products can be characterized by the following properties:
- analysis
- analytics
- connectivity
- data management
- data preparation
- data quality
- impact analysis
- scalability
- Teradata
Are you now curious about all elements (100+) of Tableau Data Management Add-on? Download directly our BI & Analytics Guide™ 2026 here.
What is Tableau Reader?
In this part, we describe Tableau Reader, including some of its features and any related products. Tableau Reader can be characterized by the following functionalities:
- analytics
- dashboards
- data visualization
- iPad
- Windows
Do you want to know the intricacies of all the functions (100+) of Tableau Reader? Then order the BI & Analytics Guide™ 2026 here.
What is Tableau Hyper?
In this section, we report the (main) characteristics of Tableau Hyper, including some of its features and any related products. Tableau Hyper can be best characterized by the following functionalities:
- analytics
- complex data
- complex data sets
- CSV
- in-memory
- java
- massive volumes
- Python
- SDK
- SQL
Are you curious about all characteristics (100+) of Tableau Hyper? Download directly our BI & Analytics Guide™ 2026 here.

What is Tableau Embedded Analytics?
We don’t reveal everything here but, in this paragraph, we describe the key elements of Tableau Embedded Analytics, including some of its features and any related products. The tool Tableau Embedded Analytics can be best characterized by the following functionalities:
- analytics
- authentication
- CRM
- dashboards
- embedded analytics
- infrastructure
- Linux
- native
- visual analytics
- Windows
Are you now curious about all features (100+) of Tableau Embedded Analytics? In that case, open the BI & Analytics Guide™ 2026 here.
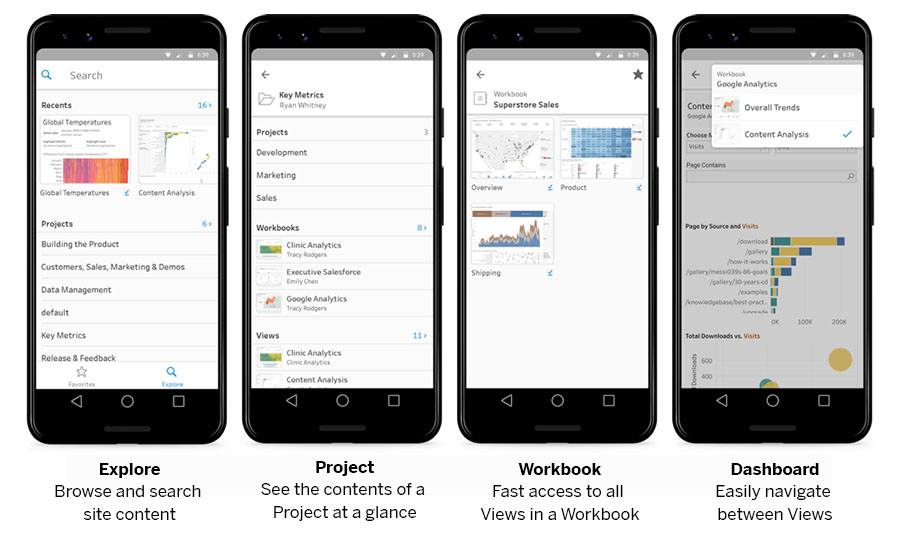
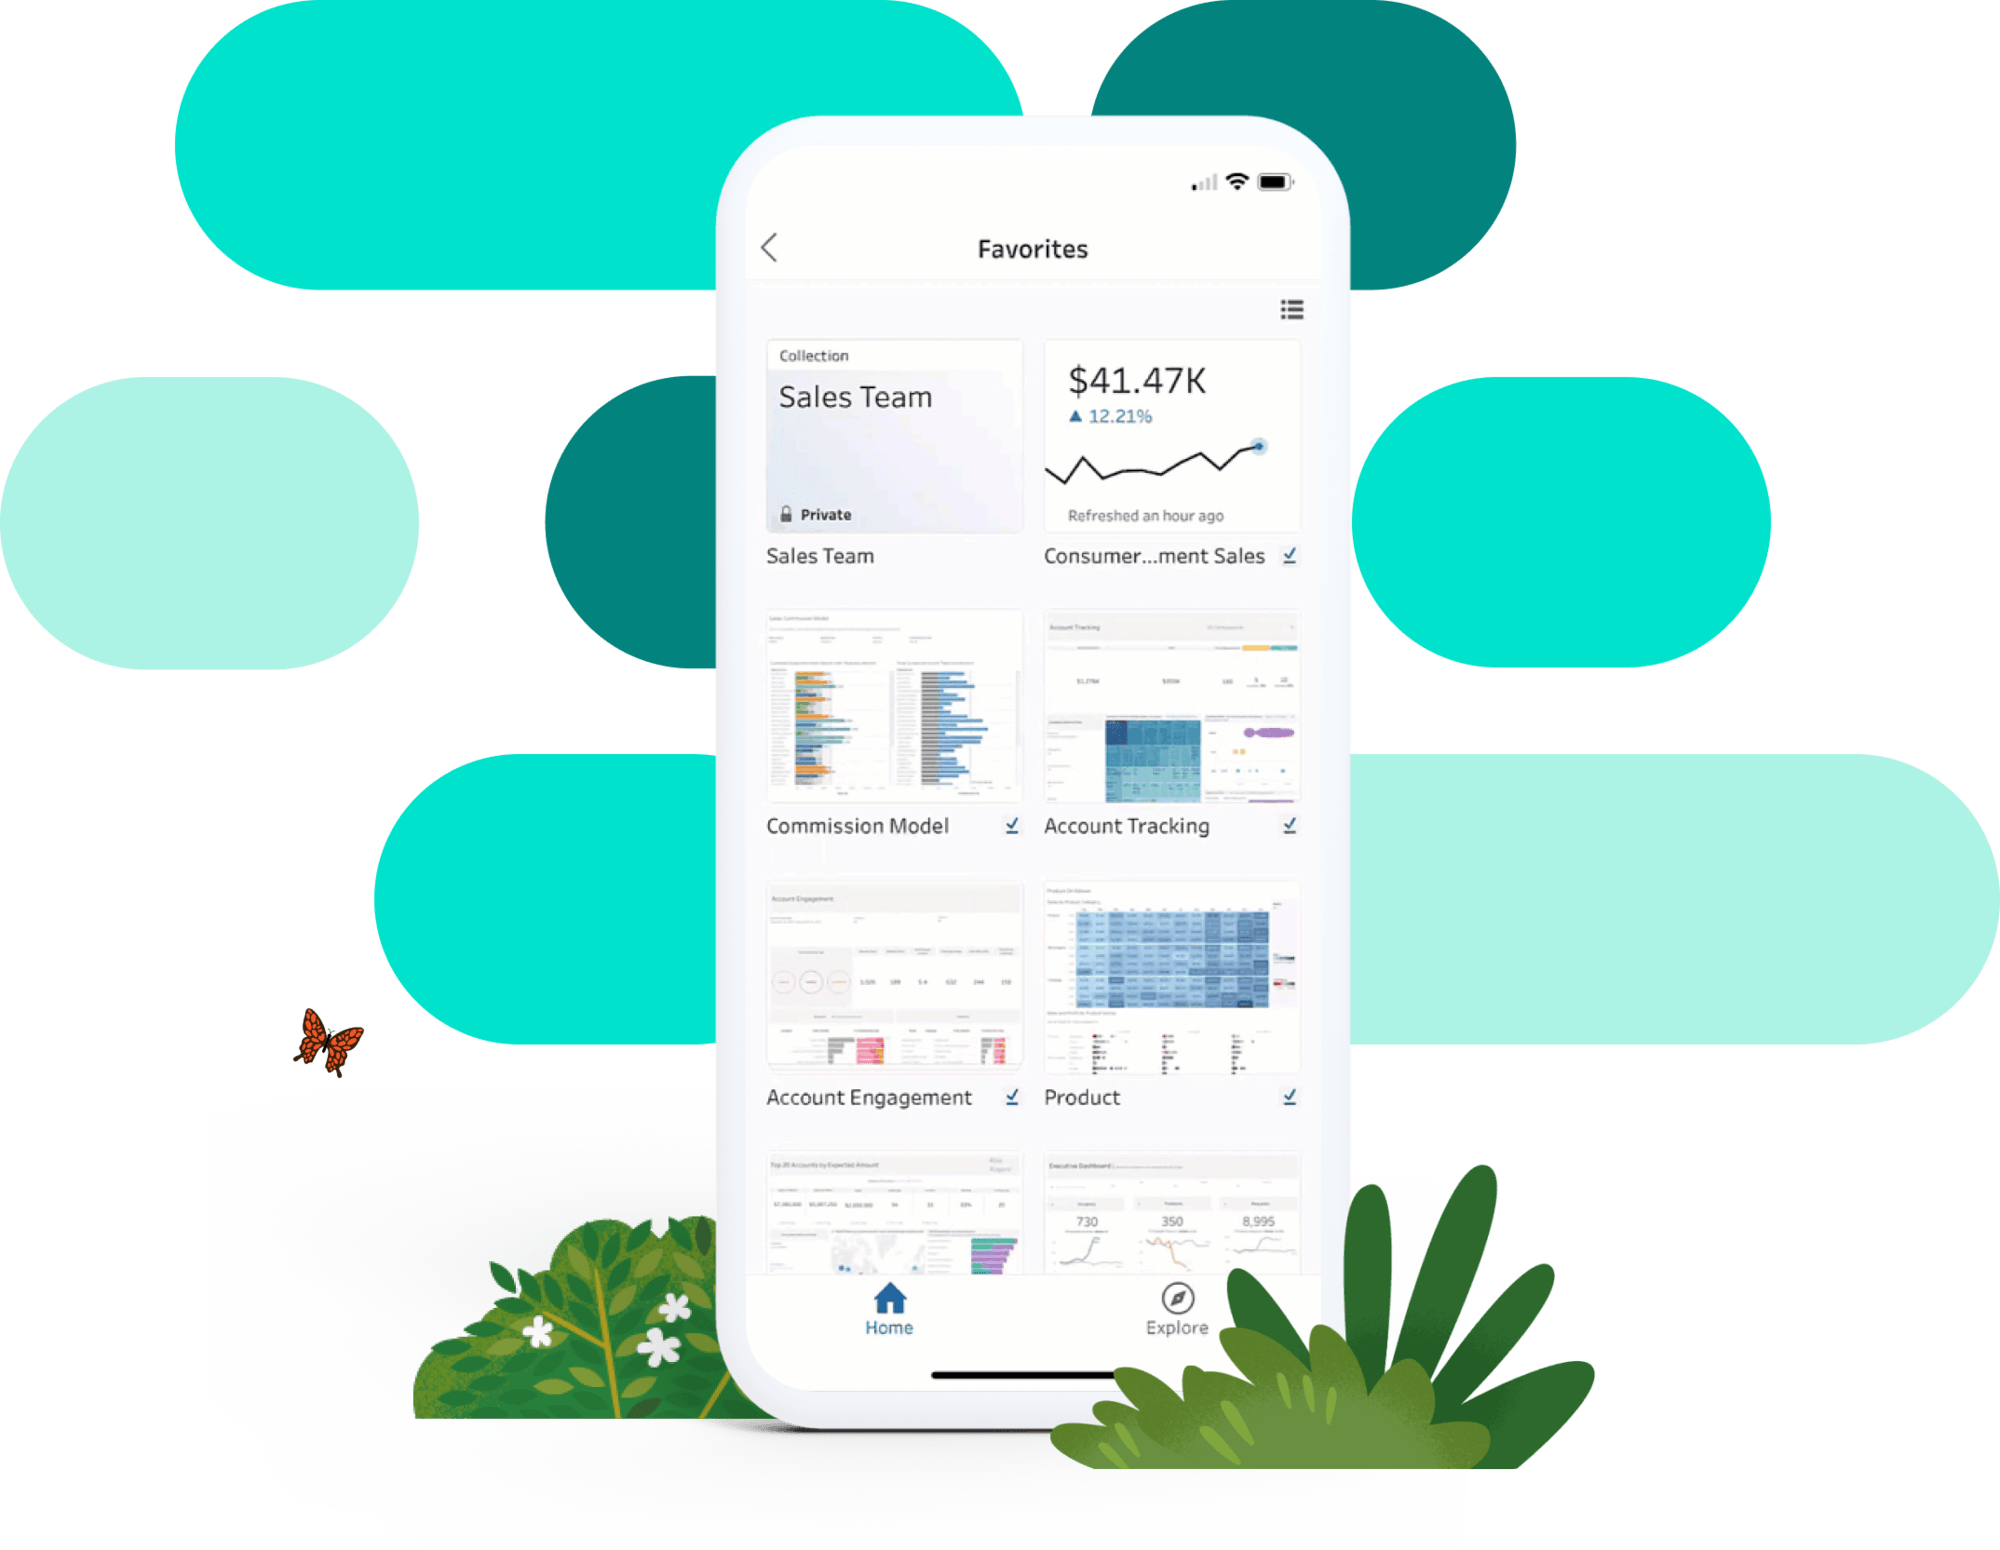
What is Tableau Mobile?
We do not display all the features here but, in this paragraph, we describe the key elements of Tableau Mobile, including some of its features and any related products. Tableau Mobile can be characterized by the following features:
- Android
- authentication
- business intelligence
- dashboards
- iOS
- iPad
- MDM
- mobile business intelligence
- mobile dashboards
- notifications
Are you now curious about all characteristics (100+) of Tableau Mobile? In that case, open the BI & Analytics Guide™ 2026 here.
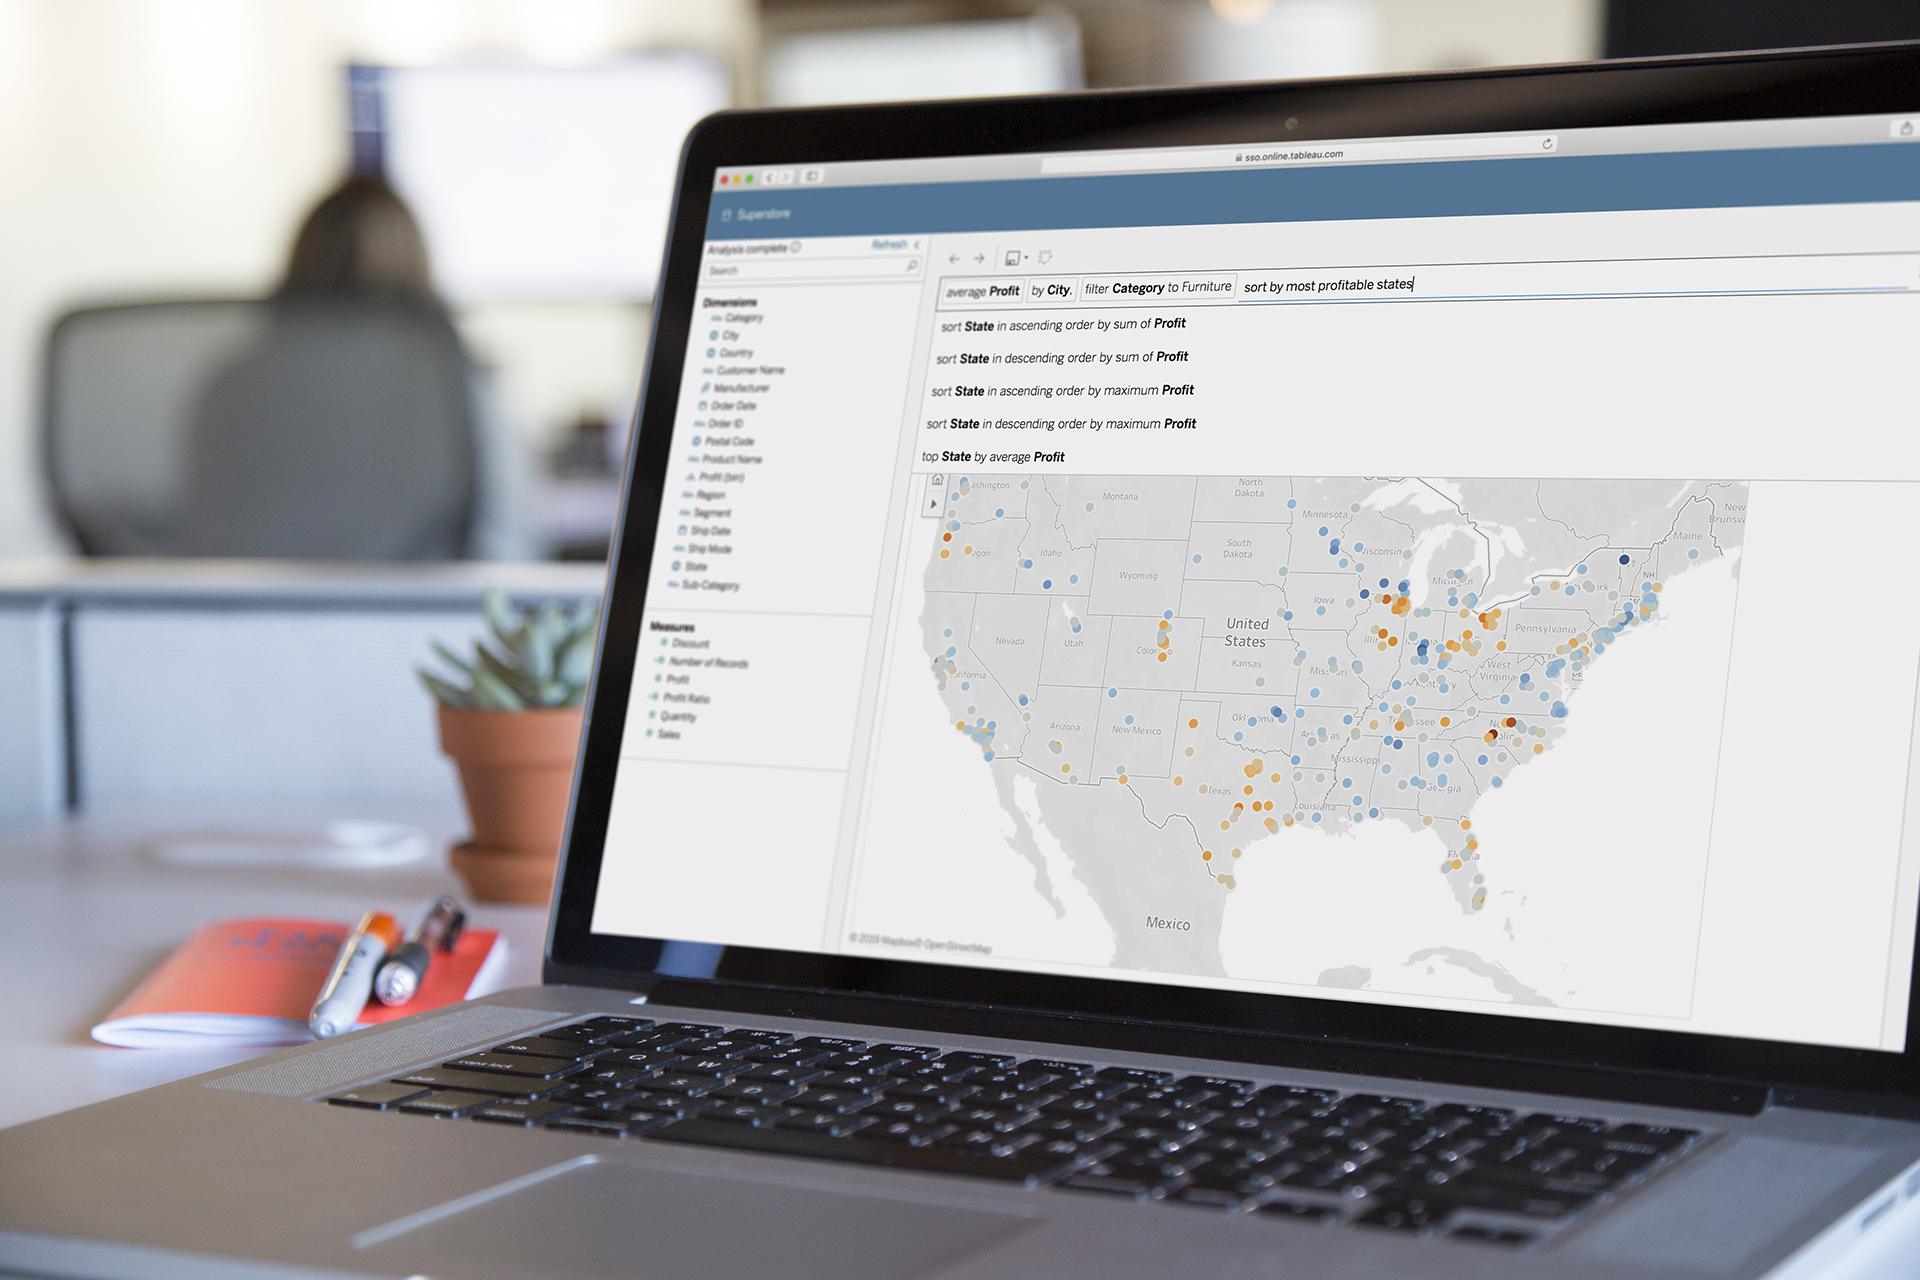
What is Ask Data?
We do not display all the features here but, in this paragraph, we provide a description of Ask Data, including some of its features and any related products. The tool Ask Data can be best characterized by the following features:
- analysis
- analytics
- analytics platform
- artificial intelligence
- augmented analytics
- dashboards
- data visualization
- machine learning
- natural language
- natural language queries
Are you now curious about all elements (100+) of Ask Data? Open the BI & Analytics Guide™ 2026 here.
What is Tableau Advanced Analytics?
In this paragraph, we report the (main) characteristics of Tableau Advanced Analytics, including some of its features and any related products. The tool Tableau Advanced Analytics can be best defined by the following properties:
- advanced analytics
- analysis
- analytics
- business intelligence
- data science
- predictive analysis
- predictive analytics
- predictive modeling
- Python
- R
Are you curious about all elements (100+) of Tableau Advanced Analytics? In that case, open the BI & Analytics Guide™ 2026 here.
What is Tableau In-memory Data Engine?
We don’t reveal everything here but, in this paragraph, we report the (main) characteristics of Tableau In-memory Data Engine, including some of its features and any related products. Tableau In-memory Data Engine can be characterized by the following features:
- analysis
- analytics
- big data
- business intelligence
- data discovery
- data visualization
- in-memory
- infrastructure
- live connection
- visual analytics
Are you now curious about all the functions (100+) of Tableau In-memory Data Engine? Then download our BI & Analytics Guide™ 2026 here.
What is Tableau Predictive Analytics?
We don’t reveal everything here but, in this paragraph, we display the details of Tableau Predictive Analytics, including some of its features and any related products. This product can be characterized by the following features:
- advanced analytics
- analysis
- analytics
- linear regression
- machine learning
- predictive analysis
- predictive analytics
- predictive modeling
- time series
- trend line
Do you want to know everything about all elements (100+) of Tableau Predictive Analytics? Open the BI & Analytics Guide™ 2026 here.
What is Tableau GPT?
In this part, we report the (main) characteristics of Tableau GPT, including some of its features and any related products. Tableau GPT can be best characterized by the following properties:
- analysis
- analytics
- augmented reality
- automated analytics
- data preparation
- data visualization
- generative AI
- natural language
- Salesforce
- waterfall chart
Do you want to know everything about all the functionalities (100+) of Tableau GPT? Download directly our BI & Analytics Guide™ 2026 here.
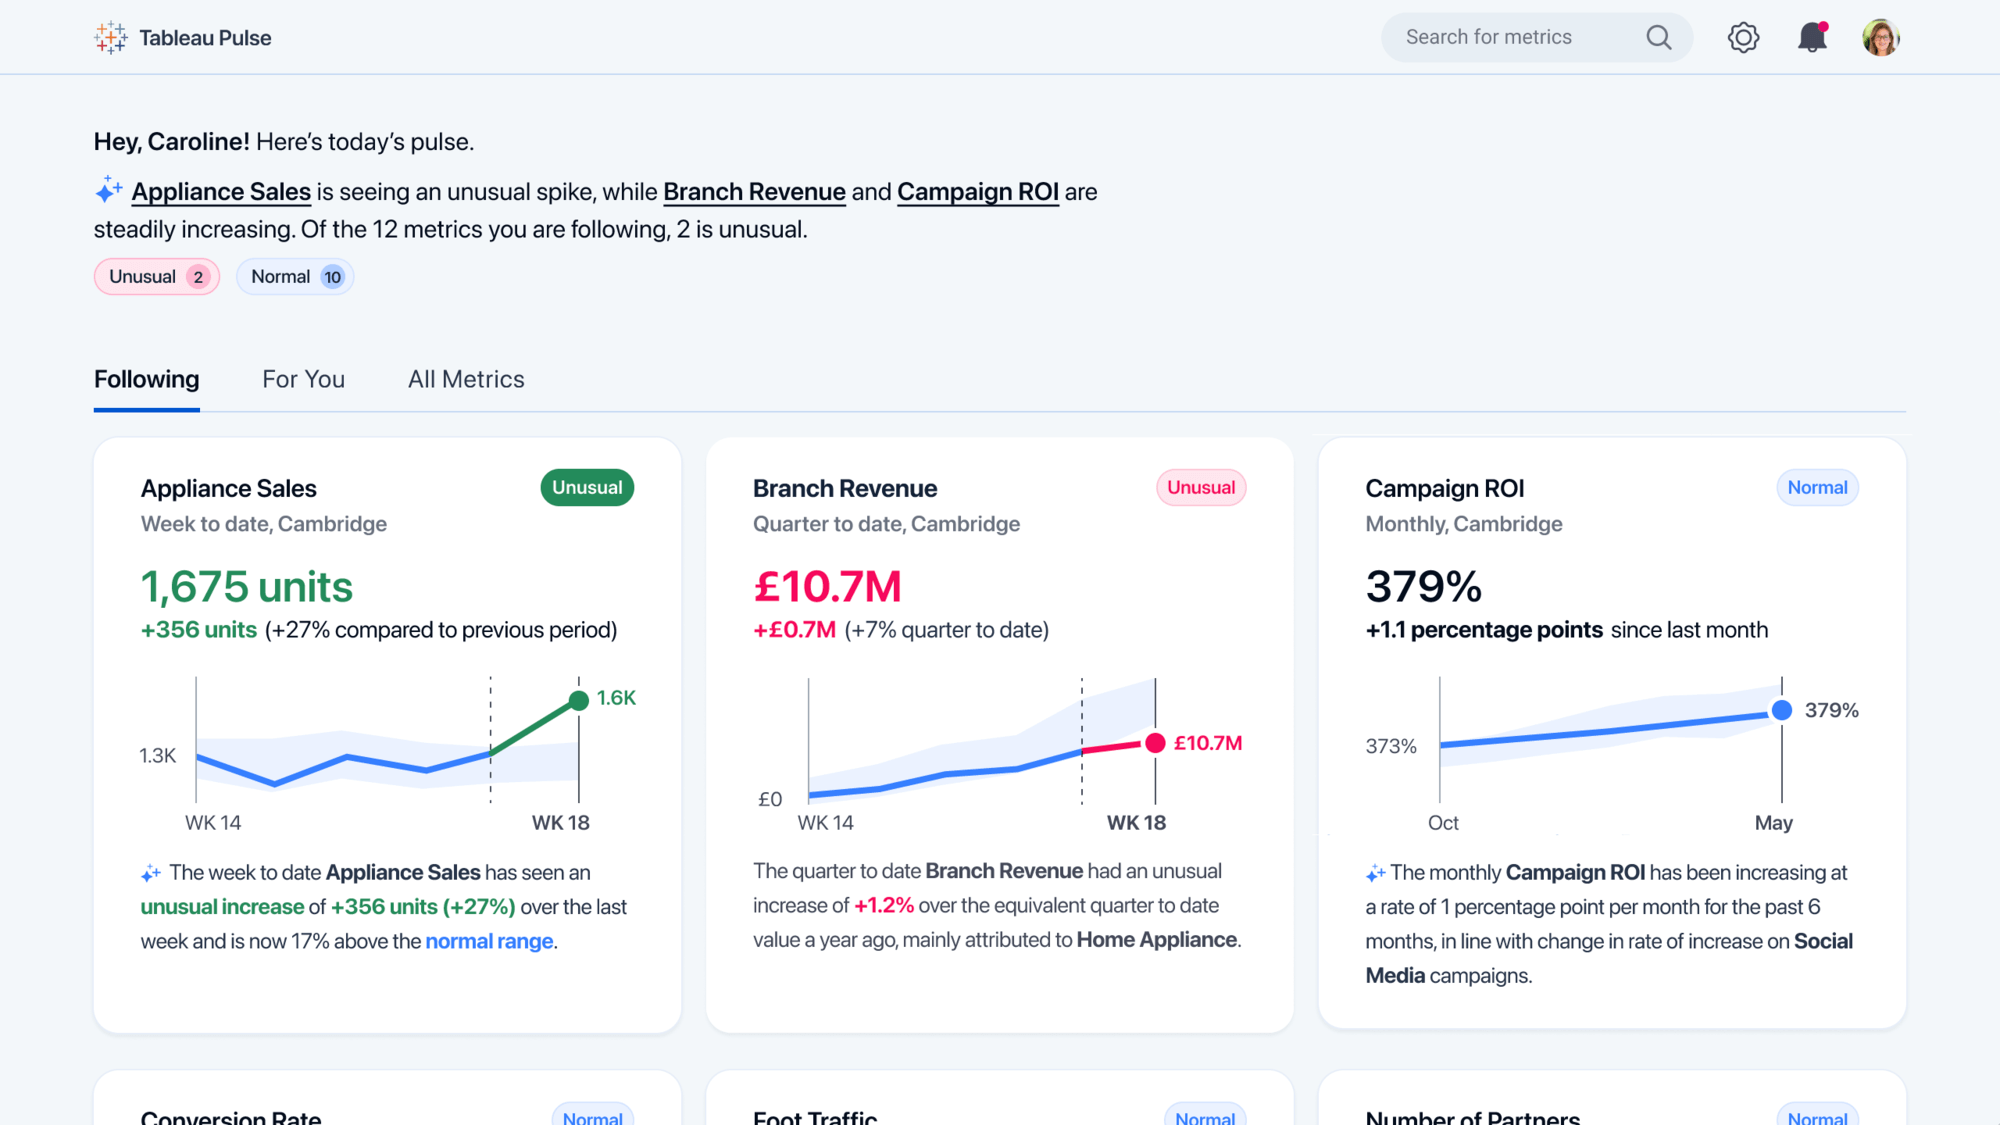
What is Tableau Pulse?
Under this heading, we display the details of Tableau Pulse, including some of its features and any related products. The product Tableau Pulse can be best characterized by the following functionalities:
- analysis
- analytics
- Android
- artificial intelligence
- generative AI
- iOS
- natural language
- notifications
- Salesforce
- Slack
Are you now curious about all the functions (100+) of Tableau Pulse? Download directly our BI & Analytics Guide™ 2026 here.
Three recent innovations Tableau Business Intelligence tools and the version history
Over time, Tableau has seen a negative evolution with respect to BI & Analytics functionality. The latest innovations are in the areas of decision management > decision planning, BI infrastructure > scalability > distributed processing, and self-service BI > self-service data discovery.
We reviewed Tableau’s current releases of its complete BI & Analytics proposition. Below we give an overview of the various releases of the various BI & Analytics products of Tableau:
- Hyper API: 0.0.18825 0.0.15888
- Tableau: 2022 2021.2 2021.1 2021 2020.4 2020.3 2020.1 2020 2019.2 2019 10.5 10.2 9.1
- Tableau Bridge: 2021.1 2020.1
- Tableau Business Intelligence: 2024.1 2023.3 2023.2 2023 2022.4 2022.3 2022.2 2022.1 2021.4 2021.3 2020.2 10.2.1 7
- Tableau Cloud: December 2022 October 2022 2023.2
- Tableau Desktop: 2024.1.0 2024.1 2023.3.3 2023.3 2023.2.3 2023.2 2023.1.8 2023.1 2022.4.9 2022.4.0 2022.4 2022.3 2022.2.11 2022.2.3 2022.2 2022.1.11 2022.1.9 2022.1.4 2022 2021.2.1 2021.2 2021.1.4 2021.1.3 2021.1.1 2021.1 2021 2020.4.7 2020.4.5 2020.4.4 2020.3.11 2020.3.9 2020.3.3 2020.3.2 2020.2.16 2020.2.4 2020.2 2020.1.2 2020.1 2020 2019.3 2019.2.4 2019.1 2019 2018.1 10.5 8.2.8 8.2 8.1 8.0.3
- Tableau Mobile: 2023.1127.7635 2023.123.6850 101
- Tableau Prep Builder: 2022.4.2 2022.4 2022.3 2020.4.1 2020.2.2 2020.1.1 22.4.26542 22.4.2
- Tableau Public: 2021.4
- Tableau Reader: 2023.1.1 2023.1.0 2023.1 2022.2 10.5.3 9.0
- Tableau Server: 2023.3.1 2023.3 2023.1.8 2023.1.7 2023.1.4 2023.1 2022.3.6 2022.2 2022.1.7 2022.1.1 2022.1 2021.4 2021.2.24 2020.2 2019.3 2018.2 10.2
- Tableau Server Management Add-on: 2022.3 2022.1.2 2022.1.1 2022.1 2021.4 2021.3 2020.4 2020.3
Behind each product, we notate the version numbers, the list is ordered by time.
What are the licensing costs of Tableau Server, Tableau Desktop, and Tableau Prep Conductor?
It is difficult to determine exactly what a license of Tableau Server, Tableau Desktop, and Tableau Prep Conductor costs because it depends on the country, the number of users (or the number of CPUs in the case of server software), the connectors to data sources, and at what point in the year you request a quote. And before the end of a fiscal quarter of Tableau, you may be able to look forward to a decent discount. As part of a cloud-first strategy, it makes sense to run the software in the cloud. Often you only pay for what you consume in resources. The purchase cost of Tableau Server, Tableau Desktop, and Tableau Prep Conductor may not be the largest amounts, but maintenance and support can certainly put quite a strain on your annual budget.
What makes Tableau BI & Analytics unique compared to other BI platforms
In our study, we see that Tableau in the field of BI & Analytics software has a number of specific features which may be the deciding factor in purchasing. This makes Tableau Business Intelligence more or less unique: data quality warnings, TSM authentication, lineage feature, pricing analytics, and JDBC connectivity.
The advantages and disadvantages of Tableau Business Intelligence
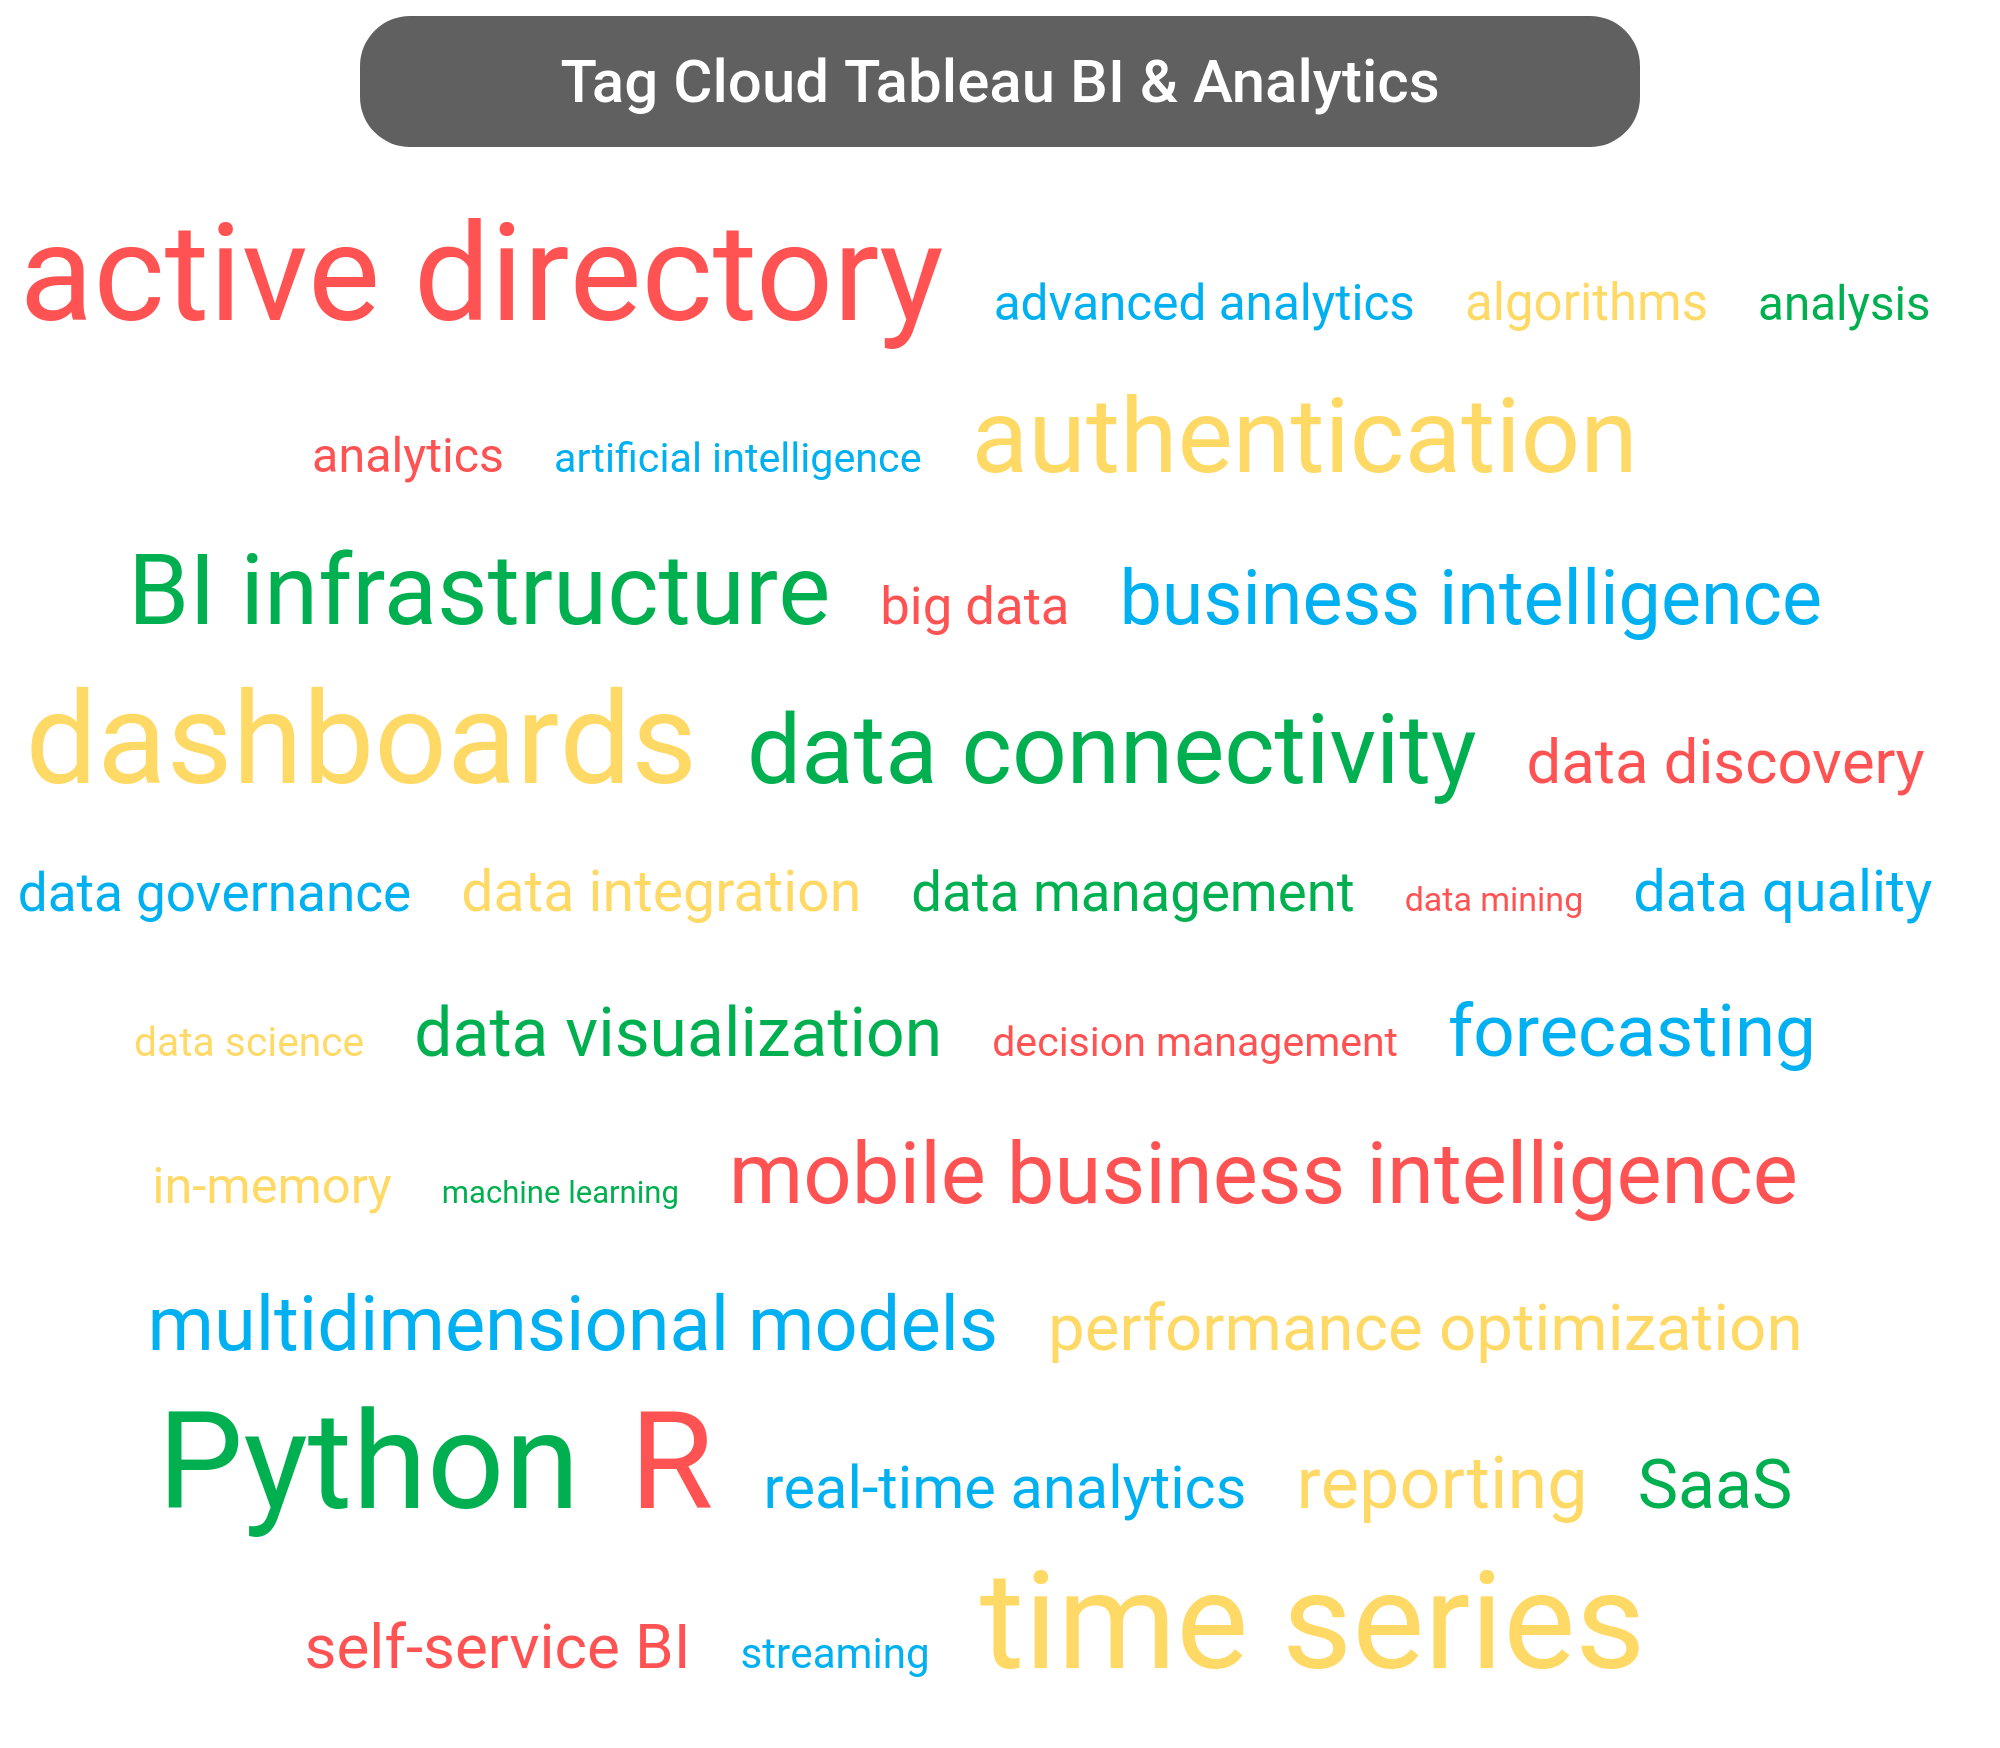 Figure 74: Tag cloud of the developed and less developed aspects of Tableau BI & Analytics
In the following sections, we describe all the advantages and disadvantages of Tableau BI & Analytics, Tableau Server, Tableau Desktop, and Tableau Prep Conductor. There is momentum, because: Tableau can currently work with partners to building on new functionality at this time (such as support for decision intelligence, Microsoft Dynamics, self-service data discovery, IFRS, KPI charts, and high-performance analytics).
Your opinion matters
Leave a review about Tableau BI & Analytics here. Your findings may then start to count and contribute to a better, even more balanced assessment of Tableau Business Intelligence.
1. Tableau Self-service BI
The company has an excellent score in our study on the subject ‘Self-service BI’ with a score of 91%, compared to other vendors. The following criteria were used: self-service data preparation, self-service reporting, self-service analysis, self-service data discovery, self-service data analytics, self-service data visualization, and self-service data exploration. In total, we examined 14 selection criteria within this main theme. Are you planning to specialize further in the topic ‘Self-service BI’? Then download here our BI & Analytics Guide 2026.
2. Tableau BI Infrastructure
The vendor Tableau has an excellent score in our study on the section ‘BI Infrastructure’. The score amounts to 86%, compared to other vendors. The following criteria were used: authentication, infrastructure, open source, hybrid cloud, and Jupyter Notebook. In total, we examined 162 aspects in this category. Would you like to learn more about the topic ‘BI Infrastructure’? Then download here our BI & Analytics Guide.
3. Tableau Data Connectivity
The vendor Tableau has an excellent rating in our objective BI & Analytics survey on the section ‘Data Connectivity’. The score amounts to 83%, relative to other vendors. The following criteria were used: Google BigQuery, MapReduce, SAP Business One, Cloudera Impala, Hadoop Distributed File System, parquet files, and DocumentDB. In total, we examined 91 criteria in this category. Would you like to delve further into the topic ‘Data Connectivity’? Then download here our BI & Analytics Guide 2026.
4. Tableau Business Intelligence
The vendor Tableau has a good score in our current BI & Analytics survey on the section ‘Business Intelligence’. The score amounts to 78%, relative to other vendors. We used the following selection criteria: reporting, enterprise business intelligence, embedded business intelligence, and business process monitoring. In doing so, we looked at the following three products: Tableau Business Intelligence, Tableau Advanced Analytics, and Tableau In-memory Data Engine. In total, we examined 73 selection criteria within this main theme. Would you like to go into more depth with the topic ‘Business Intelligence’? Then download here our BI & Analytics Guide 2026. Or take a deep dive in the following content:
5. Tableau Data Discovery
Tableau has a good score in our current BI & Analytics survey of the theme ‘Data Discovery’. The company scores 78% on this topic, compared to other vendors. We looked at the following criteria, among others: analysis, time series, and data visualization. In total, we examined 398 features within this discipline. Would you like to learn more about the topic ‘Data Discovery’? Then download here our BI & Analytics Study 2026.
6. Tableau Mobile Business Intelligence
Tableau has a good rating in our independent BI & Analytics survey on the subject ‘Mobile Business Intelligence’ with a score of 73%, relative to other vendors. The following criteria were used: Android, iPad, push notification, and mobile analytics. In total, we examined 10 criteria in this category. Would you like to learn more about the topic ‘Mobile Business Intelligence’? Then download here our BI & Analytics Guide 2026.
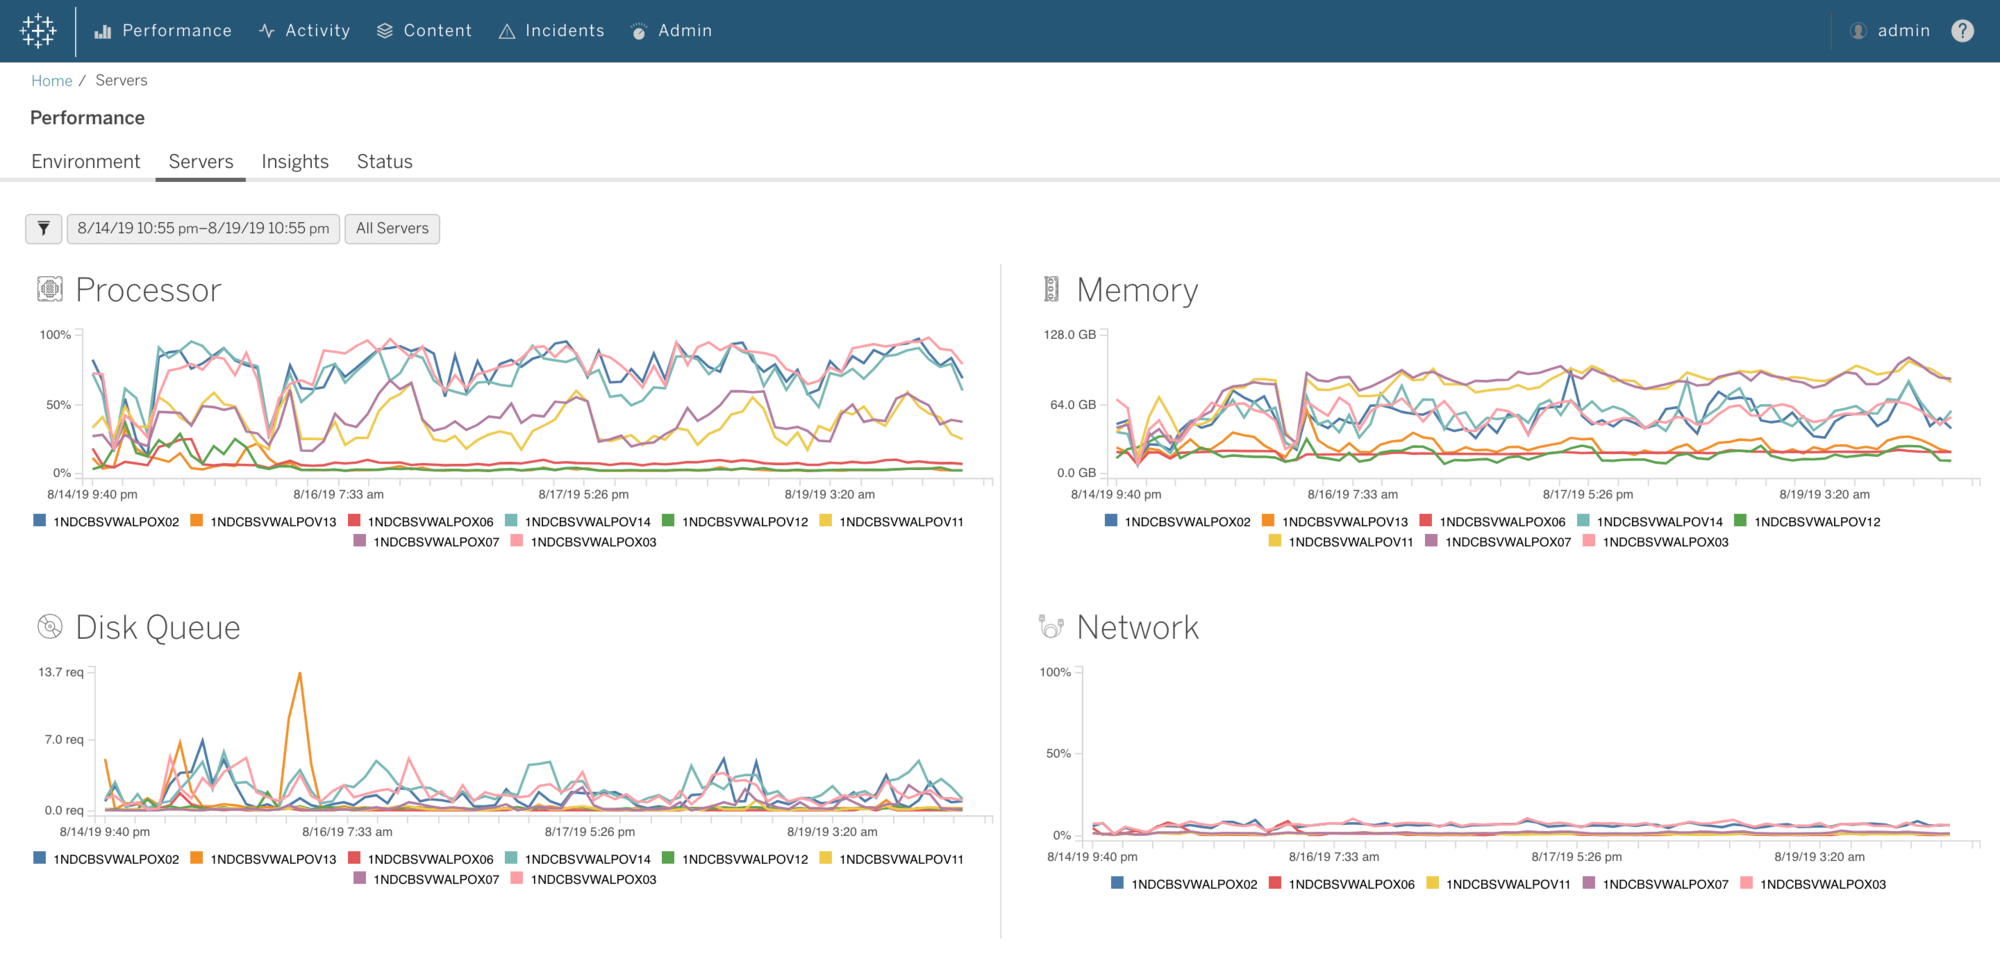
7. Tableau Performance Optimization
The company has a good performance in our 100% vendor-independent BI & Analytics survey of the theme ‘Performance Optimization’. The score amounts to 66%, relative to other vendors. We looked at the following criteria, among others: caching, parallel processing, data pipelines, materialized views, quantum computing, cached data, and cache settings. In total, we examined 29 criteria in this category. Would you like to learn more about the topic ‘Performance Optimization’? Then download here our BI & Analytics Guide 2026.
8. Tableau Analytics
Tableau has a good performance in our independent BI & Analytics survey on the subject ‘Analytics’ with a score of 66%, compared to other vendors. We looked at the following criteria, among others: customer analytics and sales analytics. In doing so, we looked at the following five products: Tableau Data Management Add-on, Tableau Public, Tableau Desktop, Tableau Online, and Tableau Server. In total, we examined 130 criteria in this category. Would you like to learn more about the topic ‘Analytics’? Then download here our BI & Analytics Study. Or take a deep dive in the following content:
9. Tableau Multidimensional Models
Tableau has a good performance in our 100% vendor-independent BI & Analytics survey of the theme ‘Multidimensional Models’ with a score of 62%, relative to other vendors. We looked at the following criteria, among others: OLAP, DAX, ROLAP, MOLAP, and tabular data models. In total, we examined 14 criteria in this category. Would you like to delve further into the topic ‘Multidimensional Models’? Then download here our BI & Analytics Guide 2026.
10. Tableau Data Governance
The company has a good performance in our independent BI & Analytics survey on the subject ‘Data Governance’ with a score of 58%, relative to other vendors. We looked at the following criteria, among others: data management, data quality, data catalog, data encryption, data lineage, and data acquisition layer. In total, we examined 91 selection criteria within this main theme. Would you like to learn more about the topic ‘Data Governance’? Then download here our BI & Analytics Guide 2026. Or take a deep dive in the following content:
11. Tableau Real-time Analytics
The vendor Tableau has a good rating in our 100% vendor-independent BI & Analytics survey on the section ‘Real-time Analytics’ with a score of 57%, relative to other vendors. We looked at the following criteria, among others: real-time, real-time data, data ingestion, near real-time, real-time insights, real-time data warehousing, and real-time big data. In total, we examined 19 criteria in this category. Would you like to learn more about the topic ‘Real-time Analytics’? Then download here our BI & Analytics Guide 2026.
12. Tableau Big Data
The vendor Tableau has a good rating in our current BI & Analytics survey on the section ‘Big Data’ with a score of 57%, relative to other vendors. The following criteria were used: big data analytics, IoT analytics, big data analysis, and in-chip big data analytics. In total, we examined 59 criteria in this category. Would you like to learn more about the topic ‘Big Data’? Then download here our BI & Analytics Guide 2026. Or take a deep dive in the following content:
13. Tableau Decision Management
The vendor Tableau has a good performance in our objective BI & Analytics survey on the section ‘Decision Management’. The score amounts to 56%, relative to other vendors. We looked at the following criteria, among others: decision support, decision intelligence, and decision-making platform. In total, we examined 30 criteria in this category. Would you like to learn more about the topic ‘Decision Management’? Then download here our BI & Analytics Study 2026.
14. Tableau Data Integration
The vendor Tableau has a good score in our objective BI & Analytics survey on the subject ‘Data Integration’ with a score of 56%, relative to other vendors. We looked at the following criteria, among others: data warehousing, data hub, data virtualization, data integration platform, data wrangling, and cross-database joins. In total, we examined 76 criteria in this category. Would you like to go into more depth with the topic ‘Data Integration’? Then download here our BI & Analytics Study 2026. Or take a deep dive in the following content:
15. Tableau Artificial Intelligence
The company has a moderate performance in our 100% vendor-independent BI & Analytics survey on the subject ‘Artificial Intelligence’ with a score of 48%, relative to other vendors. We looked at the following criteria, among others: natural language processing, business rules, computer vision, augmented reality, cognitive computing, and association rules. In total, we examined 181 features within this discipline. Would you like to learn more about the topic ‘Artificial Intelligence’? Then download here our BI & Analytics Guide.
Want to know more? Then order the BI & Analytics Guide™ 2026 here
In which sectors is Tableau BI & Analytics most active?
In our independent BI & Analytics survey, we also found out at which industries a supplier operates in. These are the industries where Tableau is most frequently used: aviation, biomedical, biotech, fashion, financial sector, hospitality, pharma, pharmacy, restaurants, universities, and utilities.
Tableau software is most used by…
The BI & Analytics software from Tableau is most often mentioned in combination with the following functions/roles: data scientists, Database Administrators, and director.
Hire an experienced Tableau specialist
Training and incompany training Tableau BI & Analytics
We provide various courses in the field of BI & Analytics but can also provide specific Tableau training, for example as in-company. In these sessions, we investigate multiple software programs and their features including Tableau Server, Tableau Desktop, and Tableau Prep Conductor. Of course, such training is framed with the ideas of the intelligent, data-driven organization.
Final Verdict: Tableau Business Intelligence scores high
Tableau has a compact product portfolio with which it scores high in our BI & Analytics survey. Tableau BI & Analytics innovates (approximately) at an average rate of [vendor-new-functions-per-year] features per year, is active (for now) in many different sectors, and is strongest in self-service BI.
About Passionned Group
![]() Passionned Group specializes in 100% independent BI & Analytics consulting and the implementation of BI & Analytics solutions. Our dedicated and passionate consultants help small and larger organizations to advance as intelligent, data-driven organizations.
Passionned Group specializes in 100% independent BI & Analytics consulting and the implementation of BI & Analytics solutions. Our dedicated and passionate consultants help small and larger organizations to advance as intelligent, data-driven organizations.