

1. Focus on a limited number of indicators
Keep the number of indicators manageable. Not too many, not too few. A rule of thumb here is: it’s better to have set of four measurable KPIs than to have forty indicators showing arbitrary information. Initially, managers as well as employees seem to need a lot of information to be able to steer well. Research has shown that managers who are capable of scanning a wide range of information perform better. Question is, though: does this mean they also need a wide range of indicators?
Balance the quantity of indicators
To be able to manage the performance of the overall organization in a balanced manner, we require a minimum of two indicators per perspective (financial, customer, internal processes, learning/growth). There is a reason for the word ‘balanced’ in the Balanced Scorecard. The reason why some managers end up with more indicators than others might be related to their responsibilities and to the degree of aggregation of each indicator. A manager who is responsible for just a small part of the process can simply do with fewer indicators. The management of a large women’s clothing chain owning 190 shops will probably need to monitor ten to twelve indicators.
People ‘pollute’ indicators with certain angles
A possible reason for a large number of indicators may be that this number includes indicators that do not supply any information on performance but on more or less given facts that cannot be influenced by a manager, such as gross margin. Another possible reason could be that the organization steers on the number of quotations, while those indicators in fact are not KPIs or KRIs whereas the success ratios of quotations are. It also happens that people ‘pollute’ indicators with certain angles. For example, they think and say they steer on four indicators, being the average processing time Boston, the average processing time New York, the average processing time Philadelphia, and the average processing time Amsterdam, while in reality this should be seen as just one indicator.
Seven indicators is a golden rule
Research among 325 managers shows that seven indicators, give or take two, is a golden rule. It is, however, recommended to set up the Business Intelligence system and its dashboard in such a way that extra information – for gaining in-depth knowledge – is available.
SMART KPI Toolkit 2024 Determine the right KPI requirements for your business with the SMART KPI Toolkit. This useful handbook contains dozens of examples, exercises, and methods for defining the right KPIs. Learn the difference between regular performance indicators and Key Performance Indicators.
2. Have common and unambiguous definitions
For Business Intelligence to be effective and efficient, one common business definition should be in place, preferably partly enforced by using one single source containing integrated information that is not only available internally but also to customers, suppliers and shareholders. As a result everyone can speak the same control language. In many organizations, particularly in the ‘boardroom’, it happens often still that time is wasted because of (latent) differences of opinion on the reliability, the meaning and the definition of information.
Different definitions jeopardizes the organization’s agility
The reason being that each manager has their own information system, and thus believes their figures are surely correct. It is even worse when people don’t even notice they work with different definitions. This not only jeopardizes the organization’s agility, it can also lead to totally unjust decisions being made on the basis of ambiguous definitions. Using unambiguous definitions becomes more and more important, both at national and international level. Working with unambiguous and common definitions and ‘meta data’ both technically and organizationally is a major concern when setting up Business Intelligence tools like Microsoft BI and Style Intelligence.
Is there a single source of the truth?
We often hear that within organizations there is no such thing as a single version of the truth, simply because the financial department for example uses a different definition for turnover than, say, the distribution center. Or an account manager will classify someone as a customer when the quotations has been signed, whilst customer service classifies someone as a customer only after a first complaint has been registered. All this makes creating a single version of the truth difficult, however not impossible.
Turnover in one part of the business process is different from turnover in another part of the business process. The first step in creating a single source of the truth consists of ‘labeling’ indicators for each step in the business process. For instance, we make a distinction between ‘Sales ordered’ and ‘Sales billed’. The second step is then to decide which of these two indicators should be classified as leading for the performance of the entire organization. The label can then be adjusted to, for example, ‘Sales (billed)’.
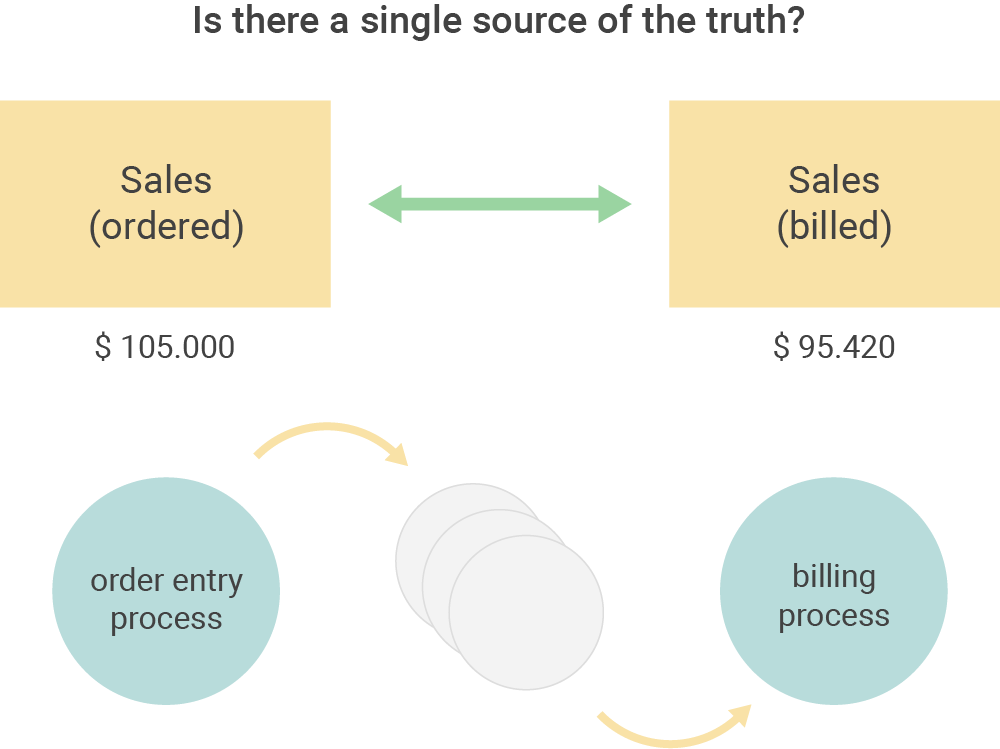
Figure 1: Within organizations there are often different definitions of revenue.
3. Have coherence and consistency
Coherence and consistency of information is an important phenomenon. They allow for a significant increase of effective communication about business operations. Generally, we may assume that the more coherence exists between information in use, the greater an organization’s capacity to adapt – and thus its intelligence – will be. Information that is useful for performance management therefore usually shows coherence and consistency in several areas:
- Coherence with operational management (in other words: what is being measured should relate to the performance of business processes).
- Interdependence (gross margin is related to both cost price value and gross sales).
- Coherence between internal and external information.
- Consistency between KRIs and KPIs (for example increased cross-selling leads to increased sales and increased market share).
- Consistency between the information and the strategy an organization wishes to employ.
- Consistency between aggregated information and detailed information.
- Coherence between the information itself and its definition.
- Coherence between financial and non-financial information – every aspect within the organization (customer visits, returns, stocks etc.) has financial impact, either direct or indirect. This means that information from the financial administration and the general ledger should be consistent with the information derived from for instance the ERP system.
4. Summarize
To optimize operational management, both the lowest and the highest levels of responsibility within an organization should, in principle, be able to use the same business definitions. For this purpose, it must be possible to summarize the information in order to make sure that the top management of an organization does not steer on anything else than on the most important information required for effective and efficient execution of business processes. In other words: the indicators are identical but the angles and aggregations levels differ. This principle is shown in the table below.
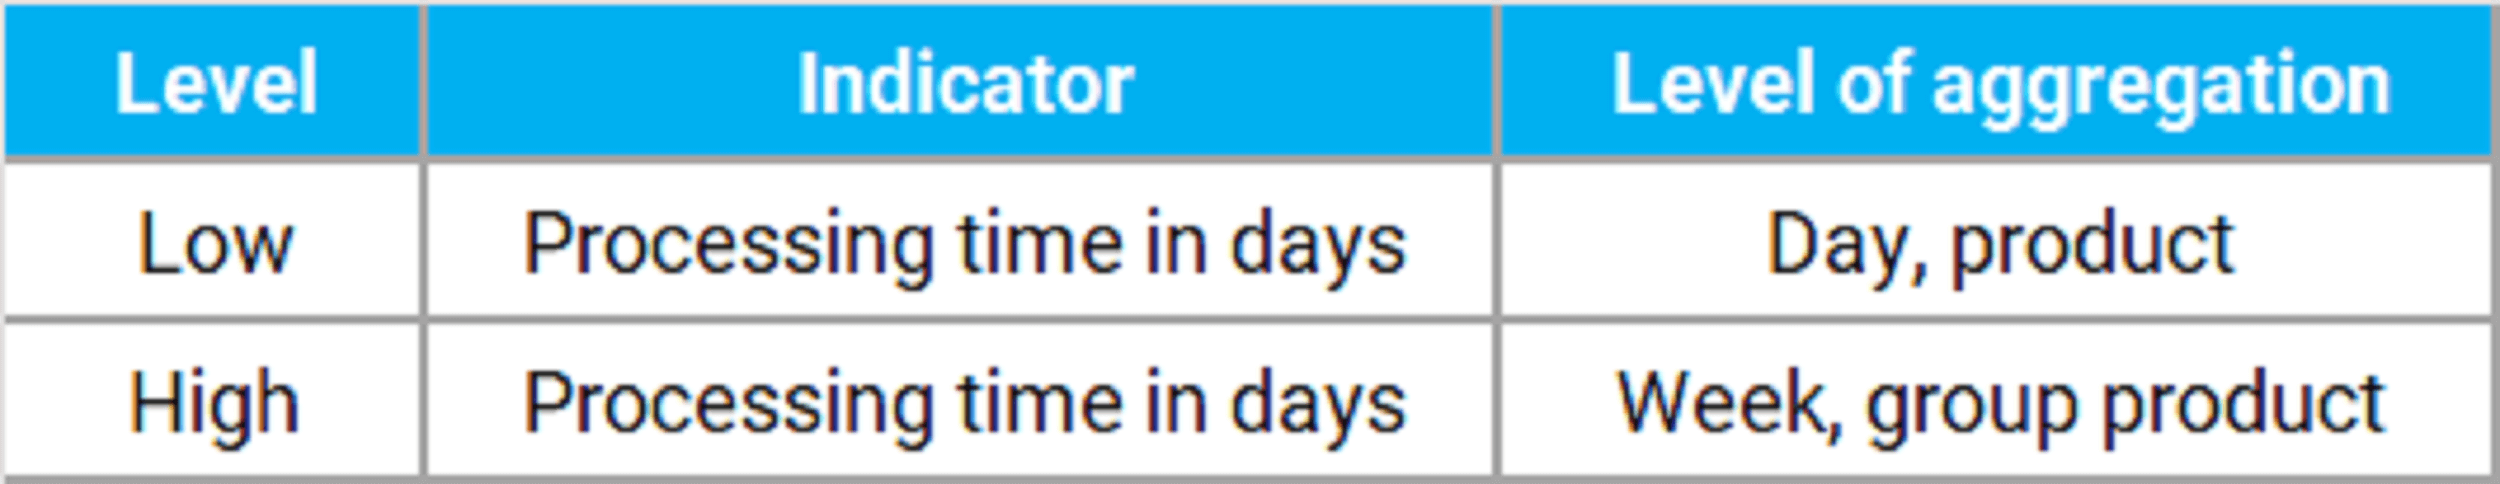 Figure 2: This is a summary of the indicators and their level of aggregations
The bigger picture
Summarizing information usually leads to more efficient communication within the organization. Everyone – at each level – then speaks the same ‘language’ and managers often know much sooner where they need to be when the information indicates a certain ‘problem’ somewhere. Usually, this requirement also offers the possibility to discover how the information came about, or how the information fits into the bigger picture and a broader context. In this way, a care manager for instance can zoom in on the offices in a certain region to get insight on the allocation of clients per office. This might come in handy when the client waiting list in that specific region suddenly increases. The sum of clients per office does have to be equal to the number listed on the higher level, that of the region. Of course there will always be exceptions that prove the rule.
Everything should fit together
It is conceivable that the highest level of the organization focuses on an ‘abstract’ indicator such as quality, while the lower levels steer on more concrete indicators such as returned goods and correction orders. It is therefore important that people at the top level can ‘descend’ to the underlying ‘concrete’ indicators and that the underlying levels can ‘roll up’ to the top level. In short: everything should fit together.
5. Make it actionable
Information should, wherever possible, be aligned with the roles, tasks and experiences of the user so that they rapidly understand what is going on and is enabled to convert the information into all possible imaginable actions requiring a minimal number of adjustment steps. The above-mentioned information requirements implicitly aim to make information ‘actionable’. Actionable information encourages its user to take appropriate and timely action effectively.

Daan van Beek MSc, speaker, trainer and author of the BI & AI book 'Data Science for Decision-Makers and Data Professionals'. He is the CEO of the Passionned Group and you can follow Daan on Twitter.