

A clear and practical definition of Business Intelligence
Data is often hidden in databases and files and will not automatically present itself to you as valuable information. You really have to look for it, you have to do something for it. We define Business Intelligence as follows:
Business Intelligence is the making of data-driven decisions and actions through automated data processing and data analysis, the production of valuable insights, reports and KPI dashboards, pattern recognition, and data visualization.
We can visualize this practical BI definition in the illustration below (see Figure 1). Information is created from data. From this information, new knowledge is created, which guides actions in improving processes. The BI process shows that Business Intelligence & data-driven work (or information-driven work) are equivalent to each other. So BI is actually a data-driven learning cycle that you implement in your organization.
And that is very different from downloading Power BI and putting together a dashboard.
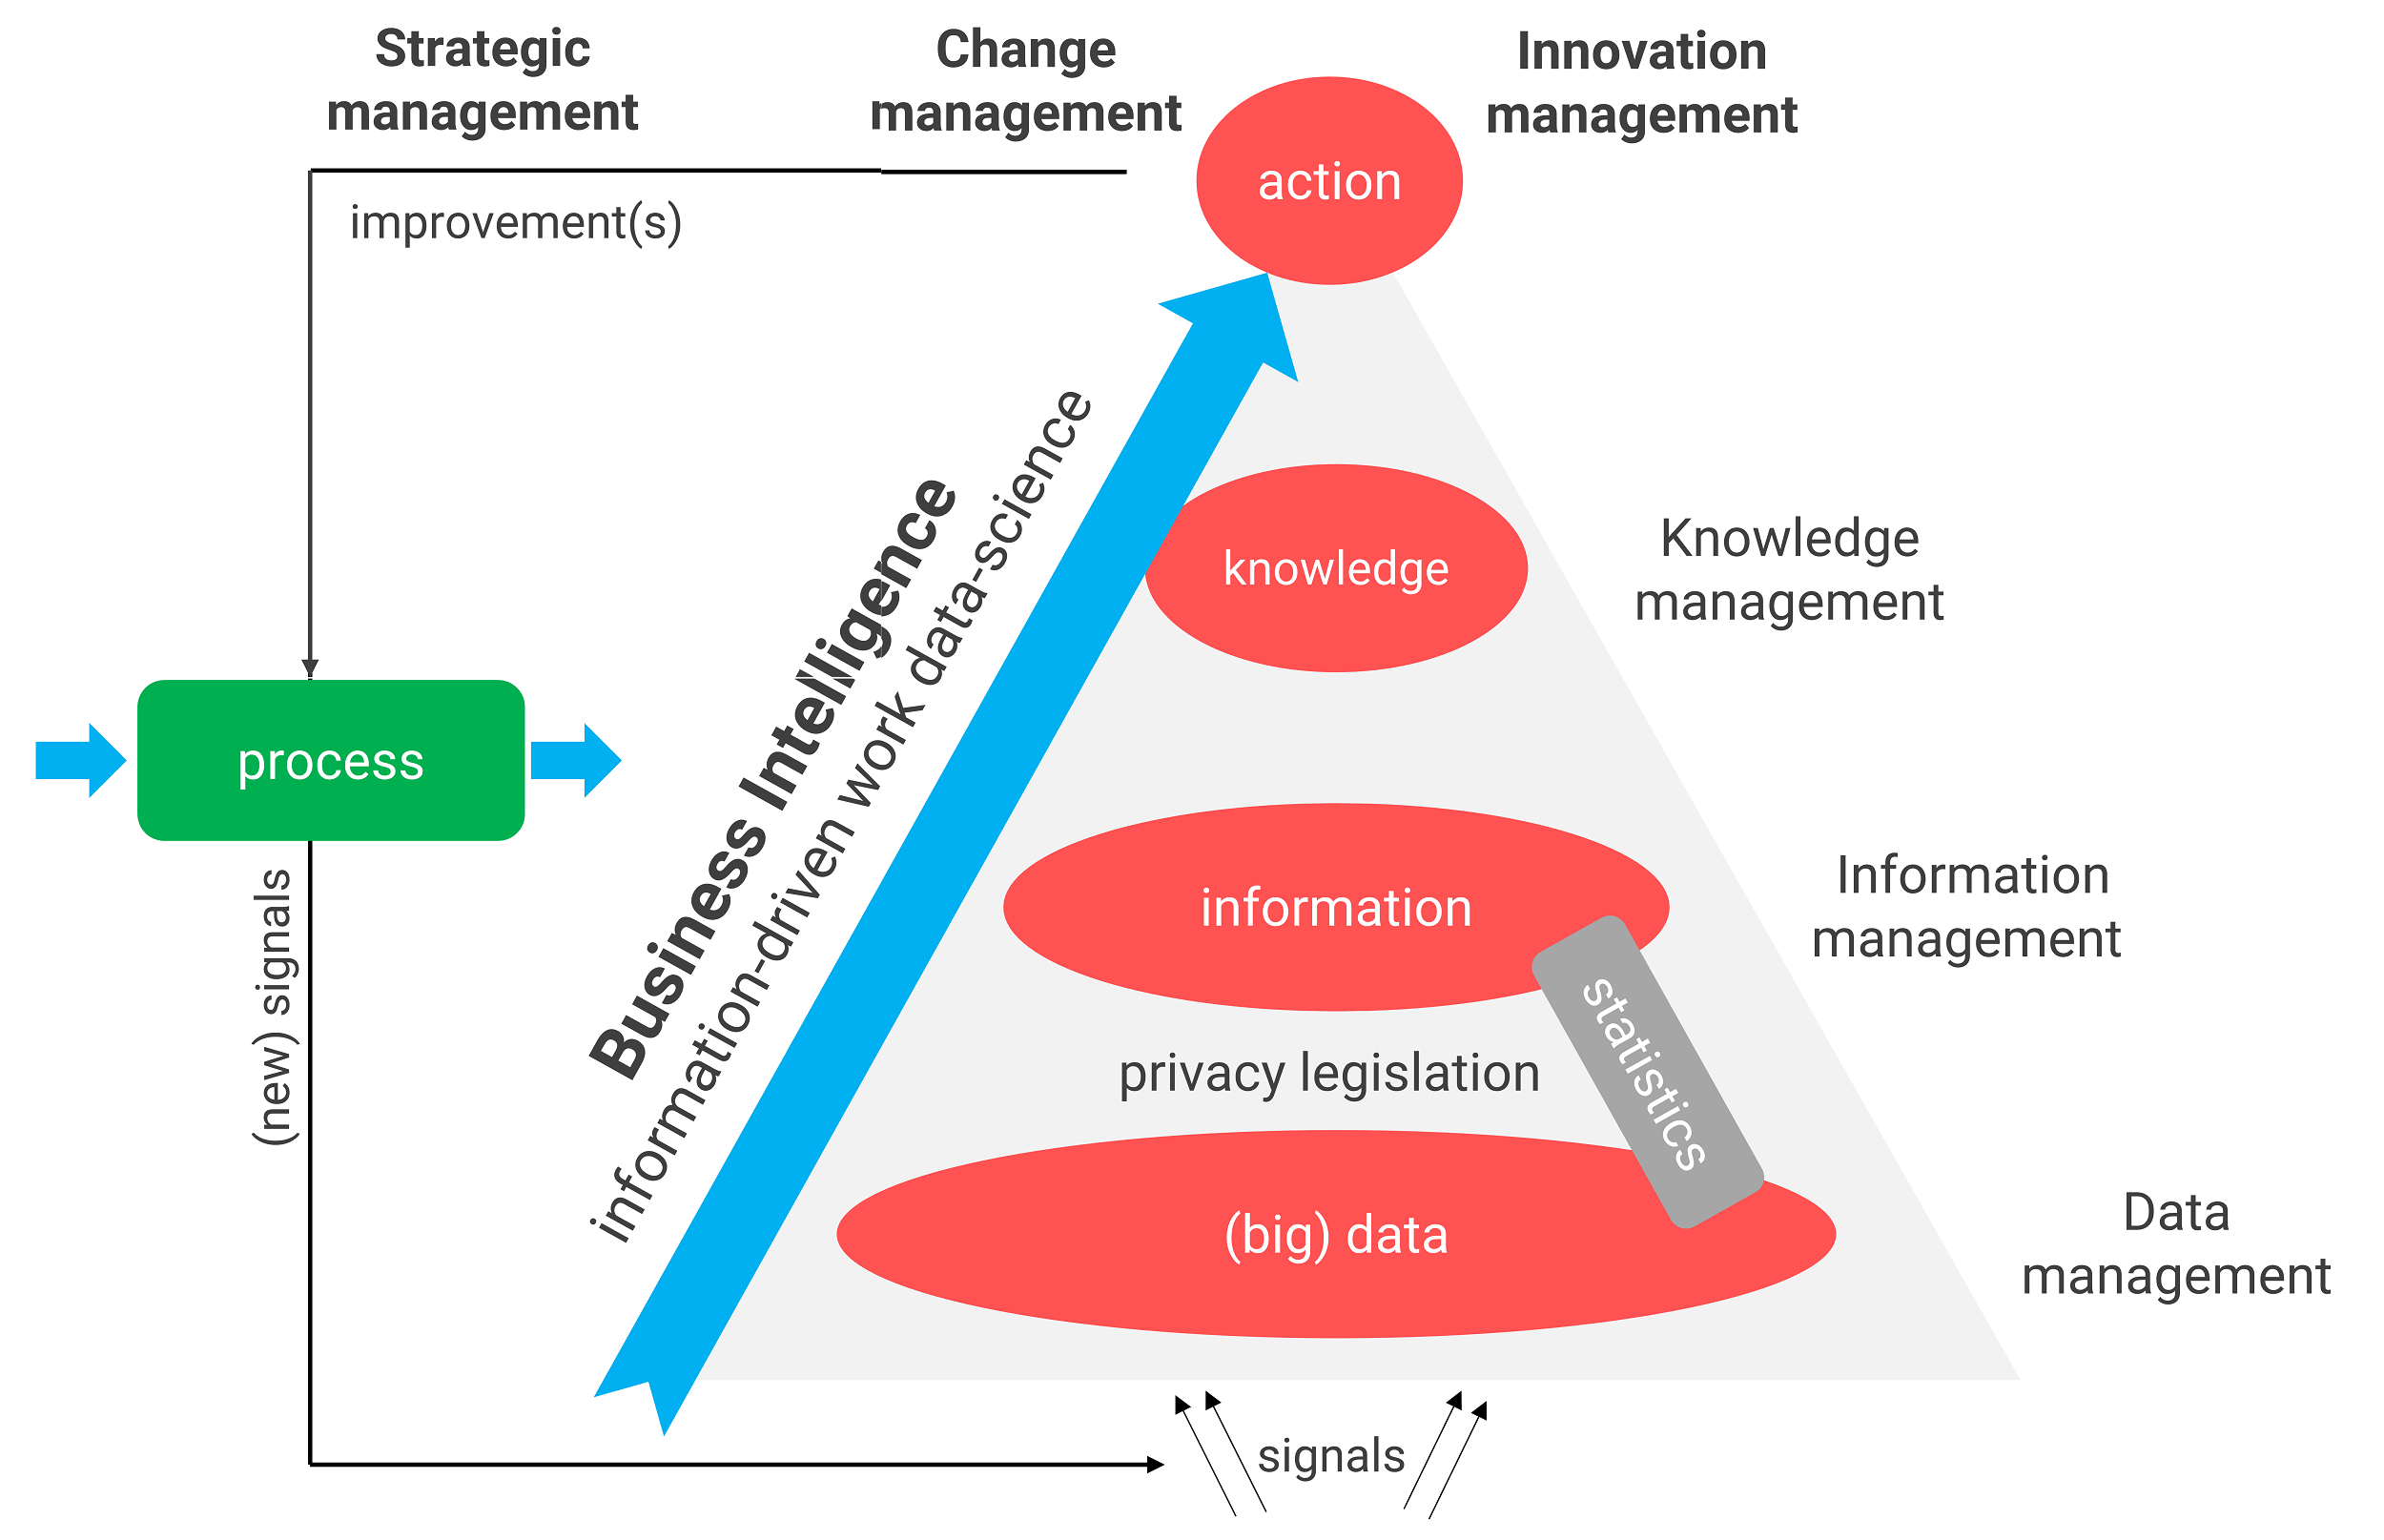 Figure 1: The Business Intelligence concept is a multidisciplinary field. It focuses on process improvement, driving innovation, and strengthening your strategy.
Unfortunately, many BI consultants and report builders still only emphasize transforming data into information. That is the least difficult part of the overall BI process. So they build entire report factories or a battery of dashboards. It’s a pattern that is very difficult to break.
We do it differently: we take the (operational) decisions and potential process optimizations as a starting point when building Business Intelligence. And then we look at what data (analyses) and insights could improve those decisions.
Different forms of BI
We talked about it in the introduction: Business Intelligence is an umbrella term. You see it coming back in different forms and flavors:
- Reporting: look in the rearview mirror at what has happened and make broad adjustments
- Dashboards: track the most important KPIs of your organization and teams on BI dashboards
- Data analysis or data discovery: analyze the data from different angles and find new insights
- Data mining: let algorithms do the analysis (semi) automatically
- Predictive analytics: train an algorithm to make predictions
- Machine learning: create a neural network that makes its own decisions
- Signaling: let alerts signal when to take action
- Data visualization: communicate the data in a format that appeals to the user
Ideally, these are not stand-alone silos but you can drill down from BI dashboards to reports or data analysis, for example. So Business Intelligence is an integral concept that you should develop a vision for.
Close the Business Intelligence gap
The growth of data is happening aggressively and quickly. Every other year we manage to double the total volume of data worldwide. At the same time, the complexity in society is increasing and you need to make good decisions faster and faster. There is a surplus of data and a glaring lack of data analysis.
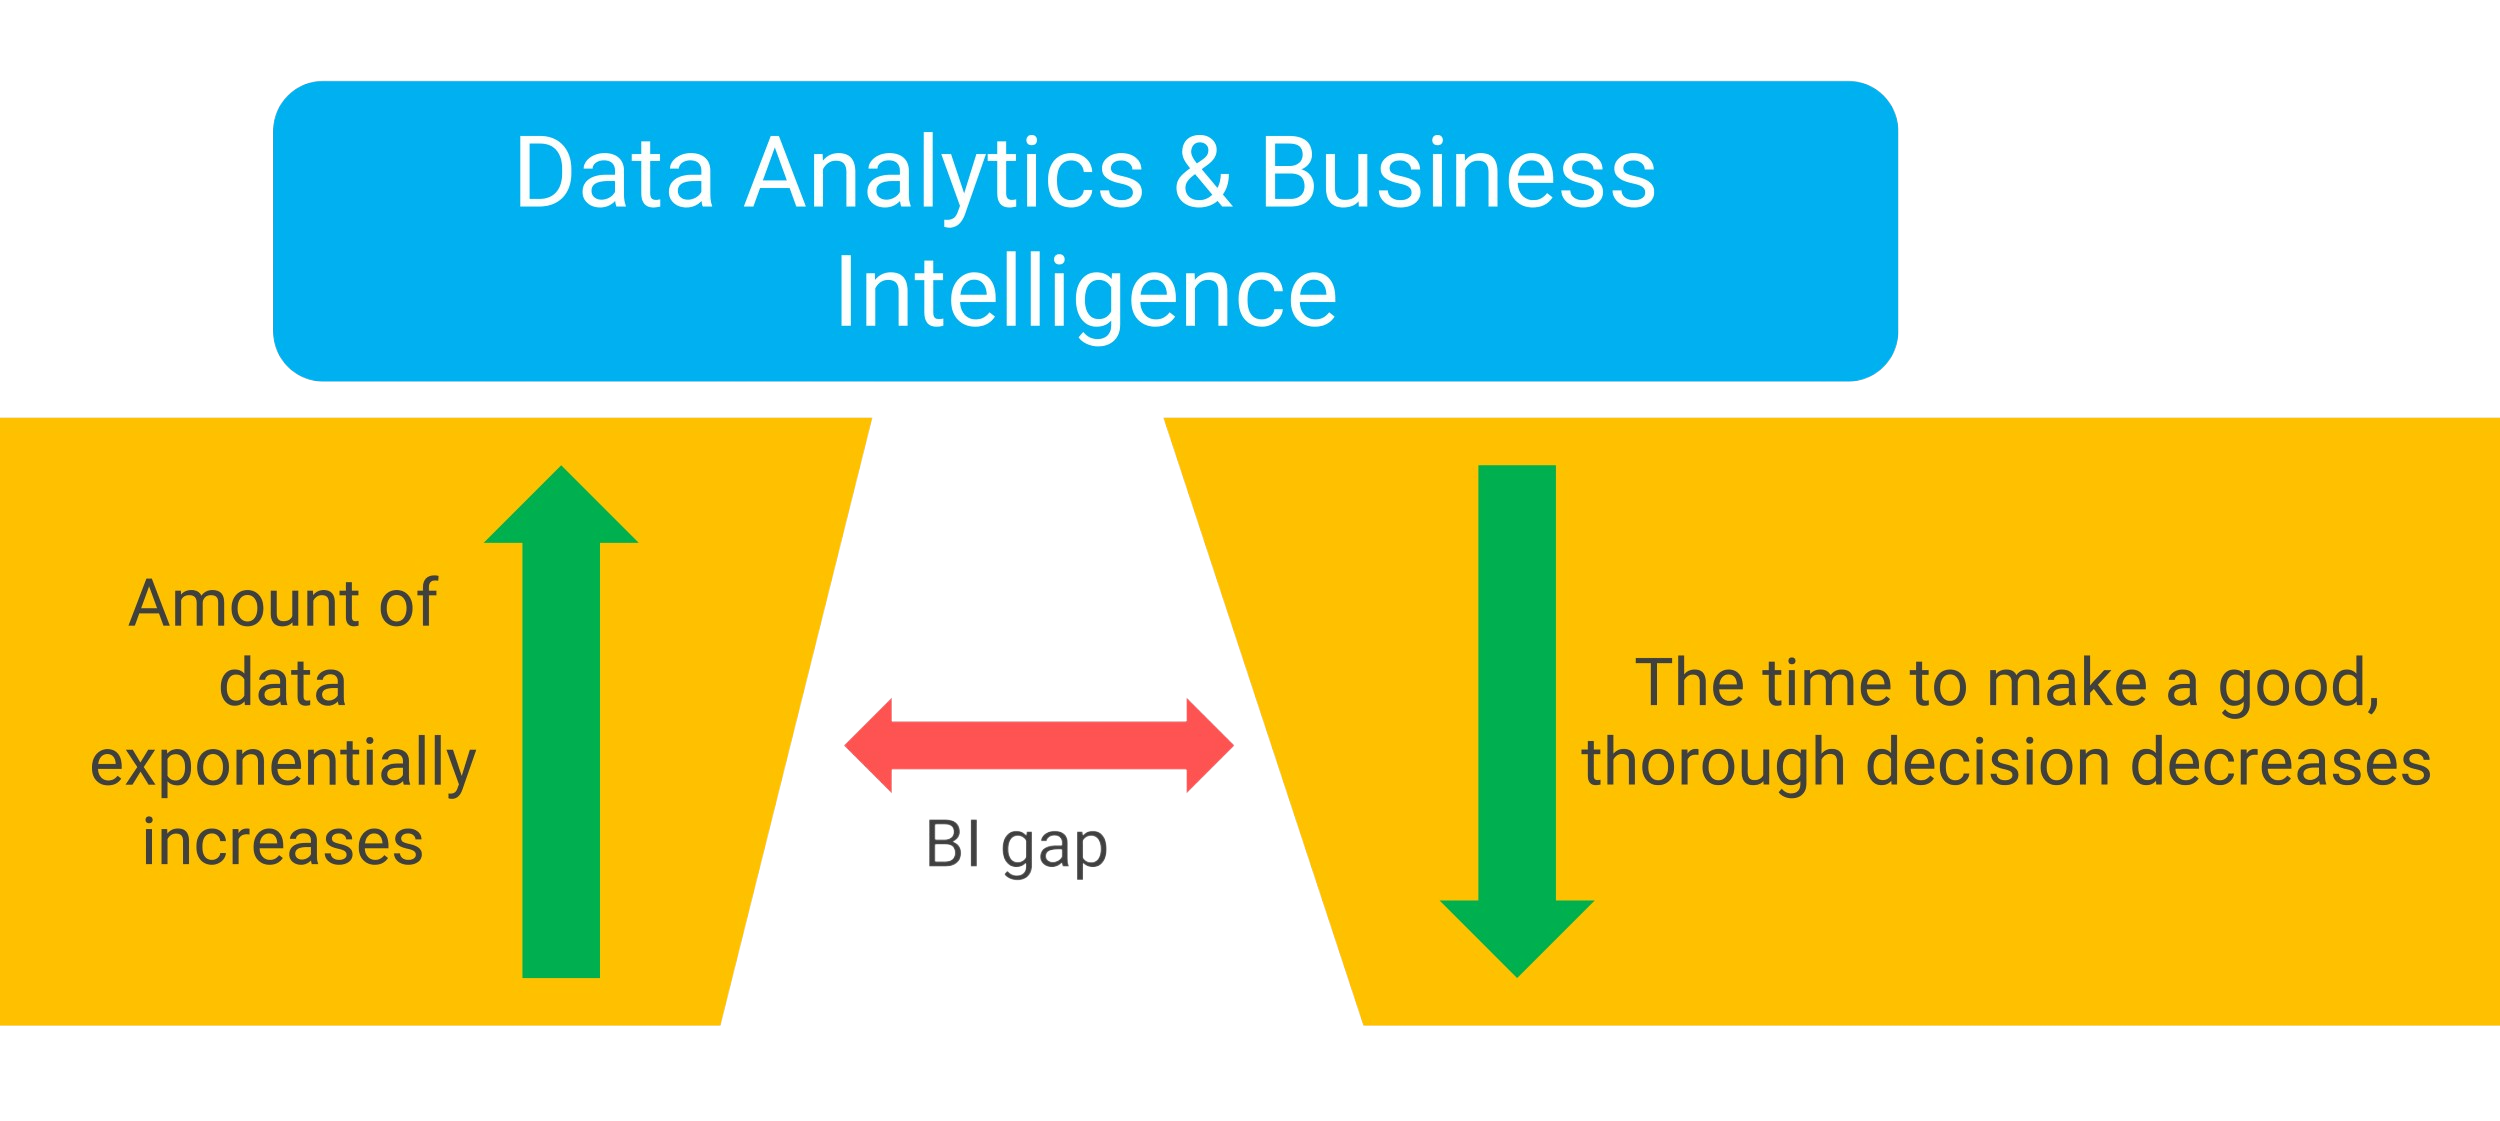 Figure 1b: Business Intelligence as a platform to bridge the gap between the exponential growth of data and the ever-shortening time you get to make good decisions.
The major challenges that are around the corner in closing the BI gap are: setting up a data warehouse, building a good team, setting up the KPIs, and determining what products and services you will deliver from BI.
Why should you deploy Business Intelligence?
We make decisions every day. To purchase items, to send an e-mail to a customer, to determine the price of a product, et cetera. There is no shortage of decisions.
Unfortunately, more than half of the decisions are made on autopilot. Often based on outdated knowledge, years of experience, and intuition. That’s how we usually do it, right? But then you often miss the mark.
With Business Intelligence you don’t have to necessarily switch off your intuition, but combine it with facts, statistics, and data analysis. So that from now on you can make informed decisions. We have devised a scheme for this.
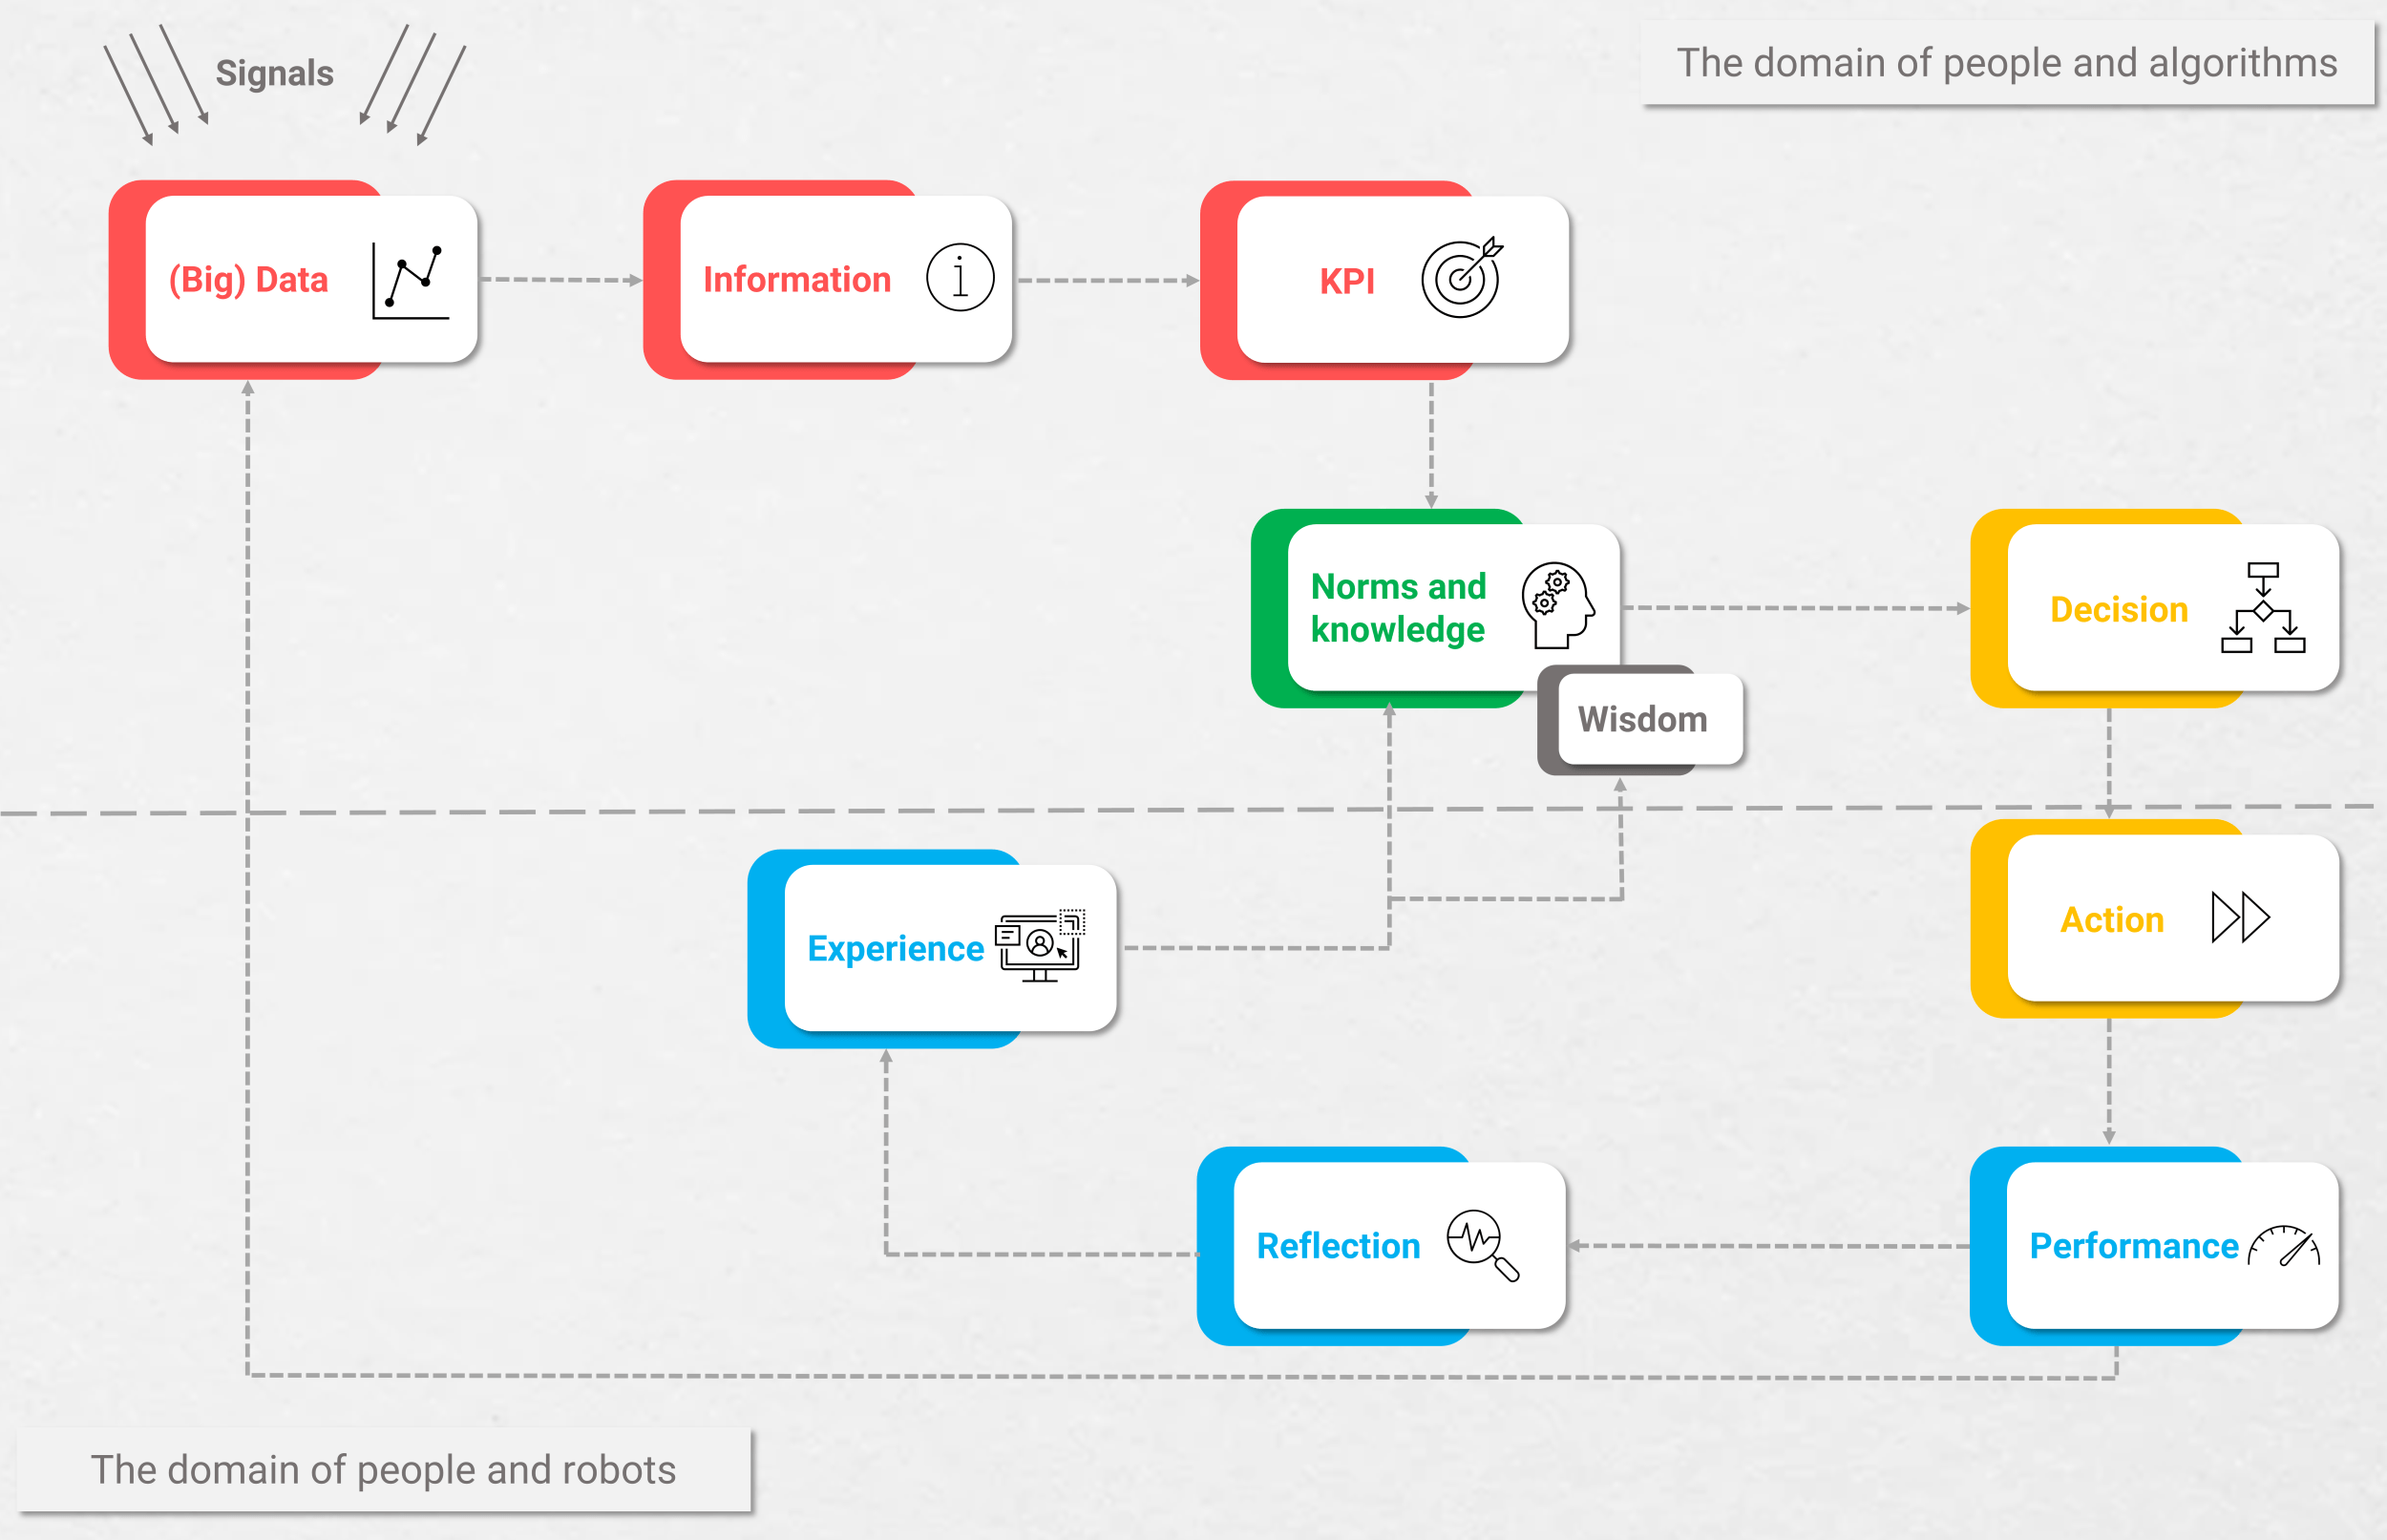 Figure 2: When shaping your Business Intelligence, take the (operational) decisions as a starting point. In our 3-day Business Intelligence training you will learn how to apply this diagram to your organization.
This illustration (Figure 2) clearly shows the reason to use Business Intelligence. You take the operational and tactical decisions in your process as a starting point. Then you examine what knowledge (KPIs, standards, wisdom), information, and data (tables, fields, raw data, open data) you need to make a good decision, in order to optimize it next time.
A decision leads to one or more actions that in turn lead to a certain performance. At that point, you actually measure whether your decision turned out well, in several areas. You reflect on this together and that produces a new, shared experience.
With this you can easily fine-tune the whole process together. Business Intelligence automates the whole process. Initially, BI will not make the decisions itself, but in combination with machine learning models and artificial intelligence (AI), it can even do that.
Examples of Business Intelligence dashboards
A picture says more than 1,000 words. Therefore, we present here six different Business Intelligence dashboards (in Dutch) that we have created. Click on the dashboard to view it in large format.
Business Services
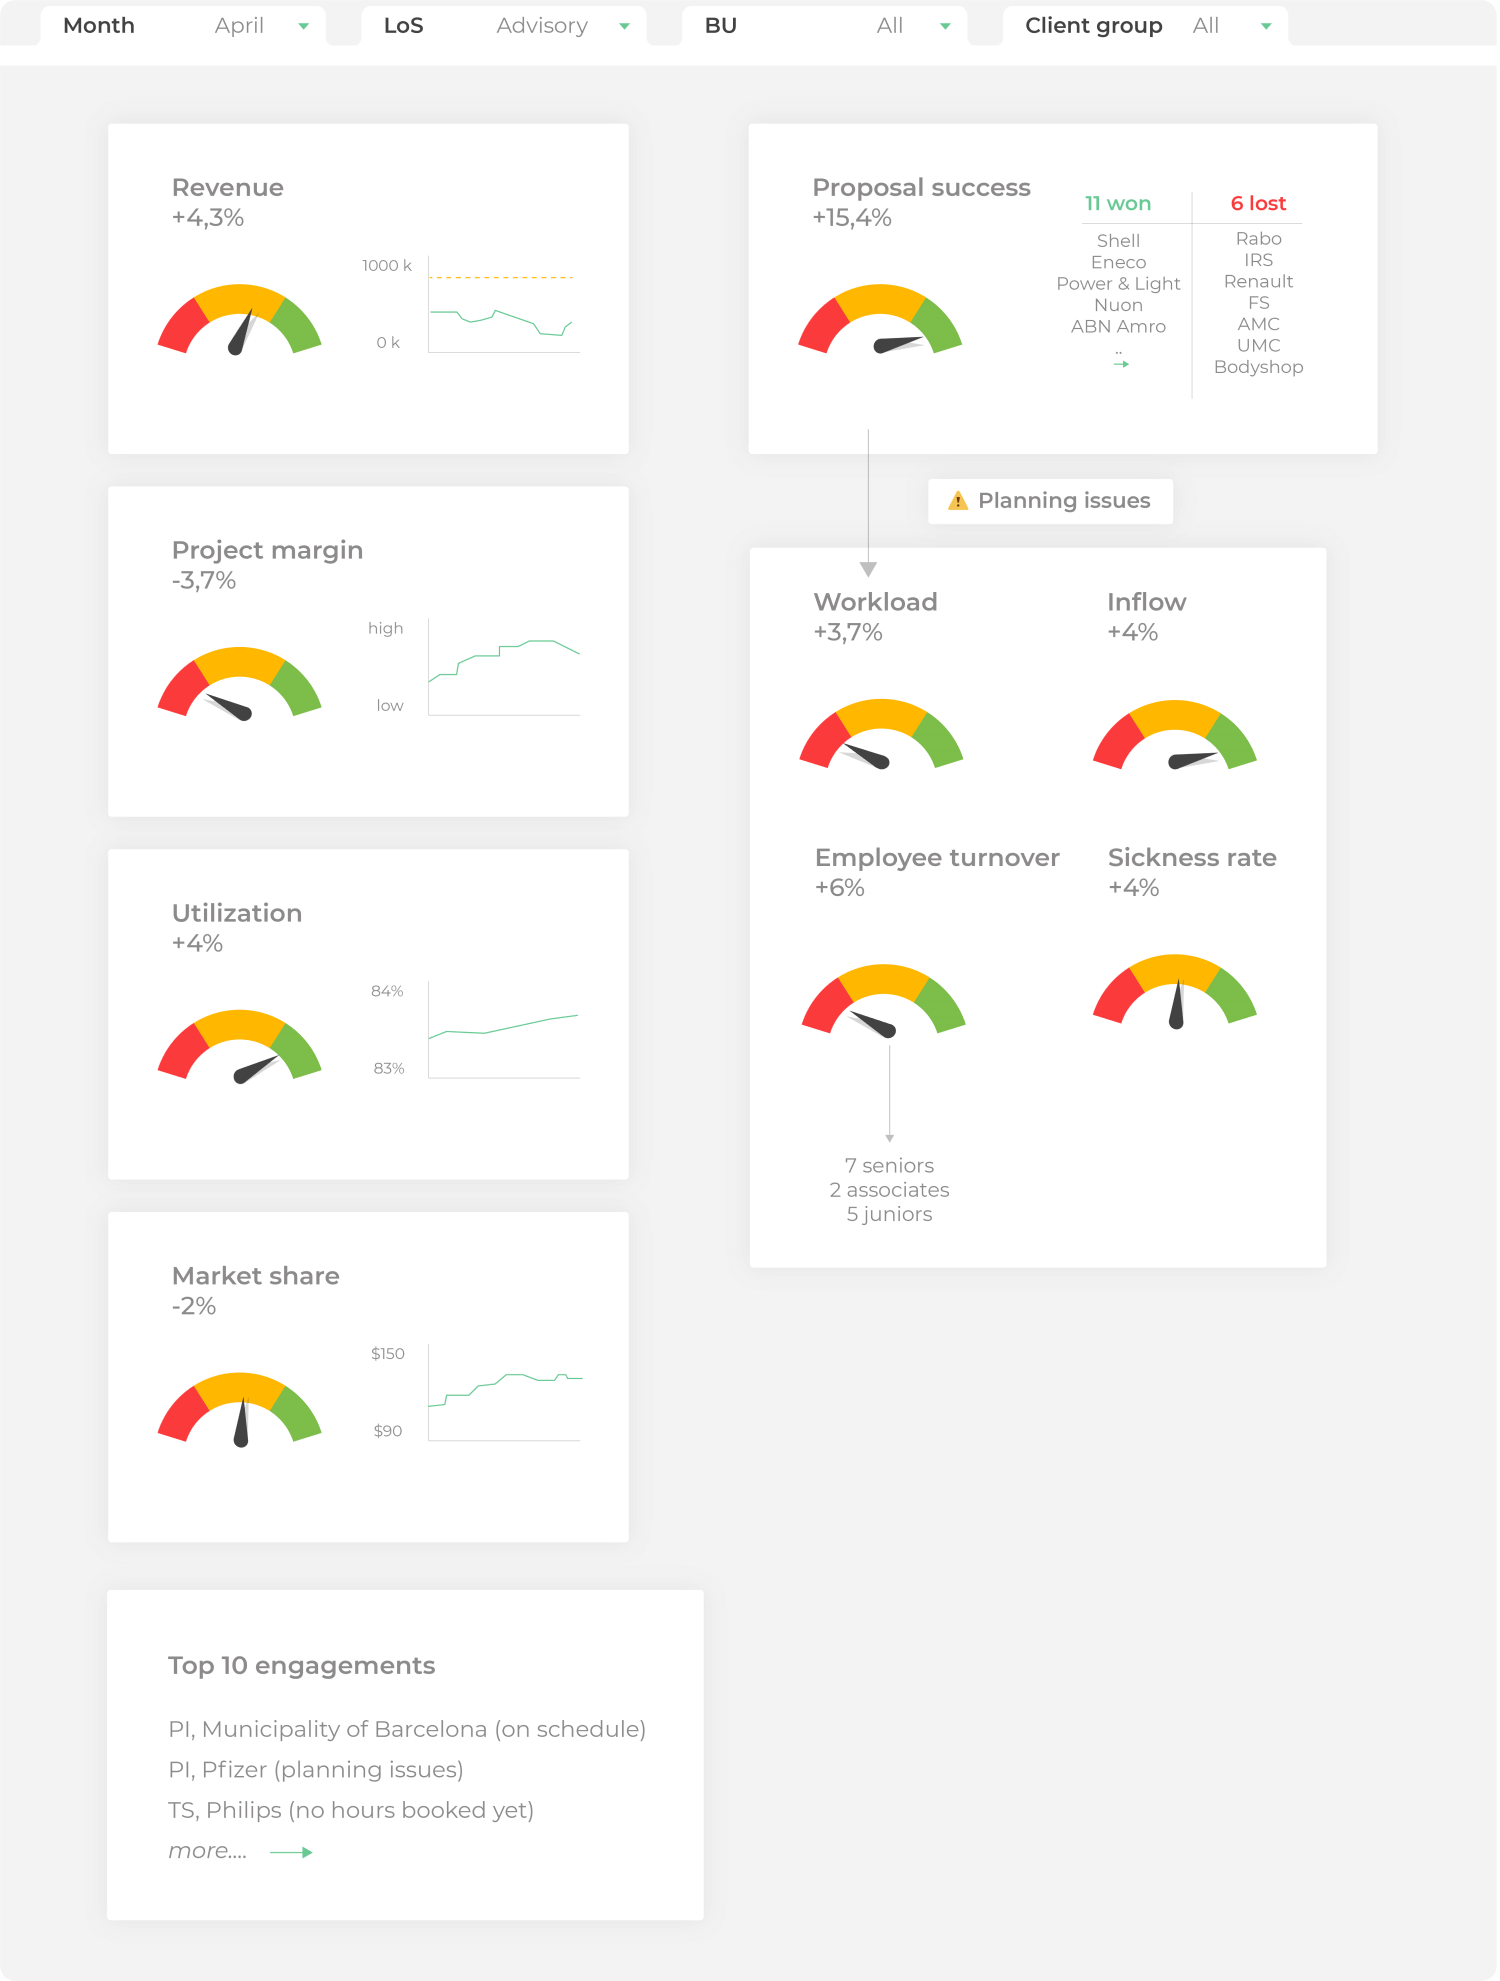 Figure 3: Example of a Business Intelligence dashboard for business services.
Local government
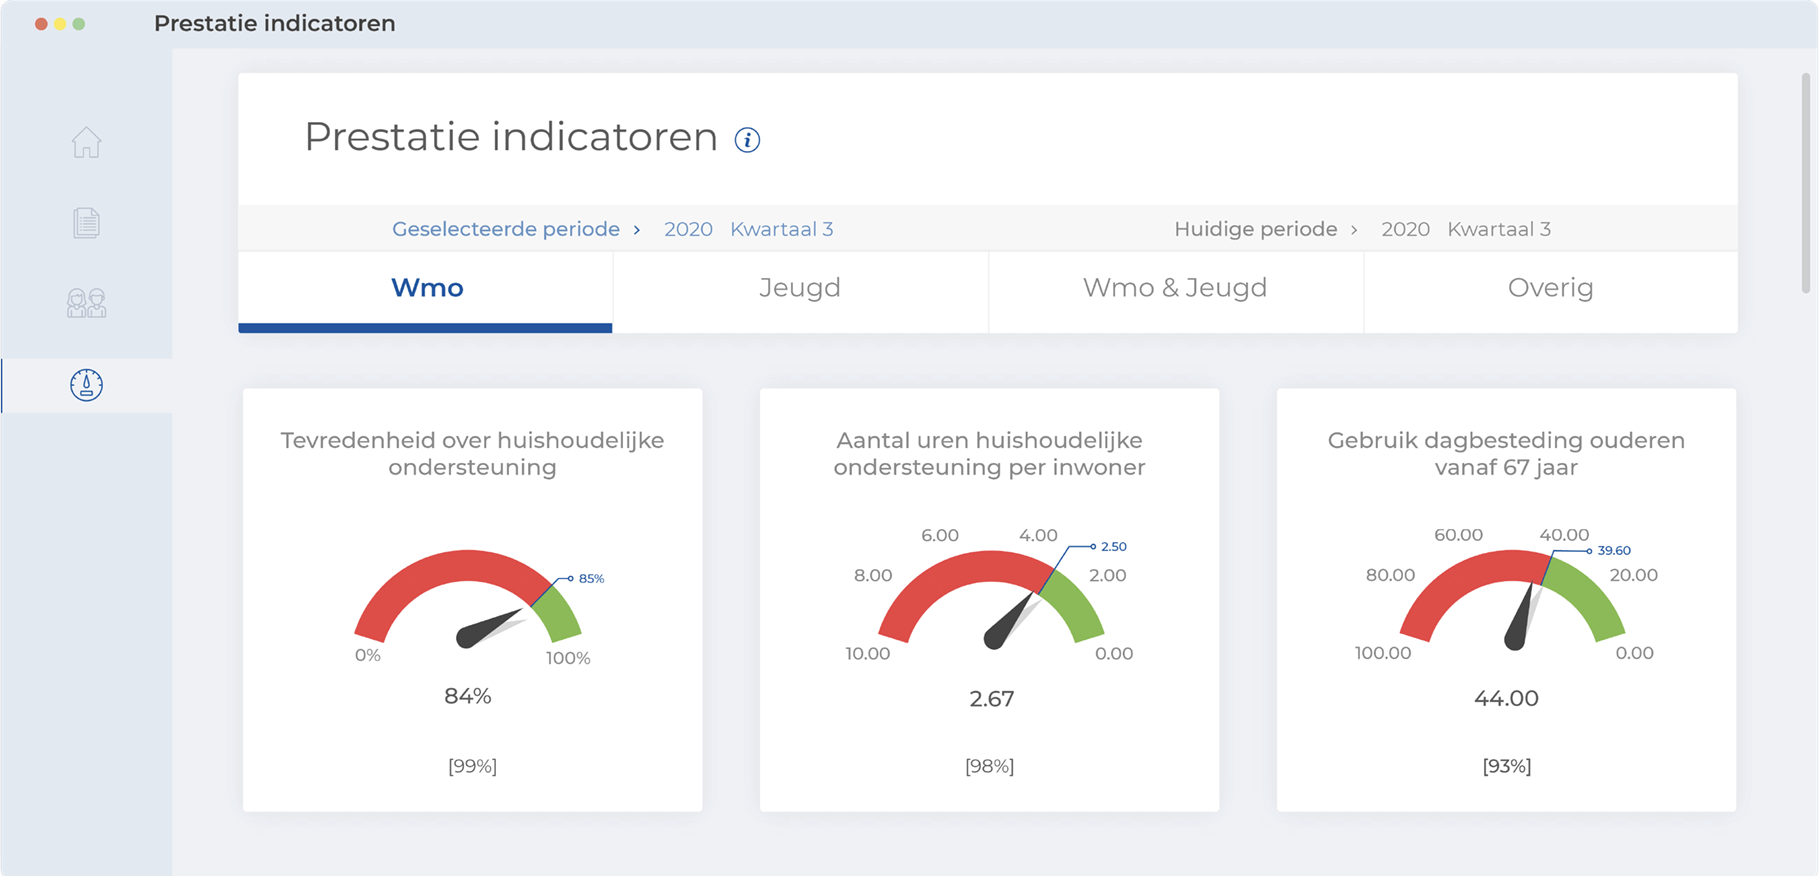 Figure 4: Example of a Business Intelligence dashboard on behalf of a municipality procuring elderly care.
Food industry
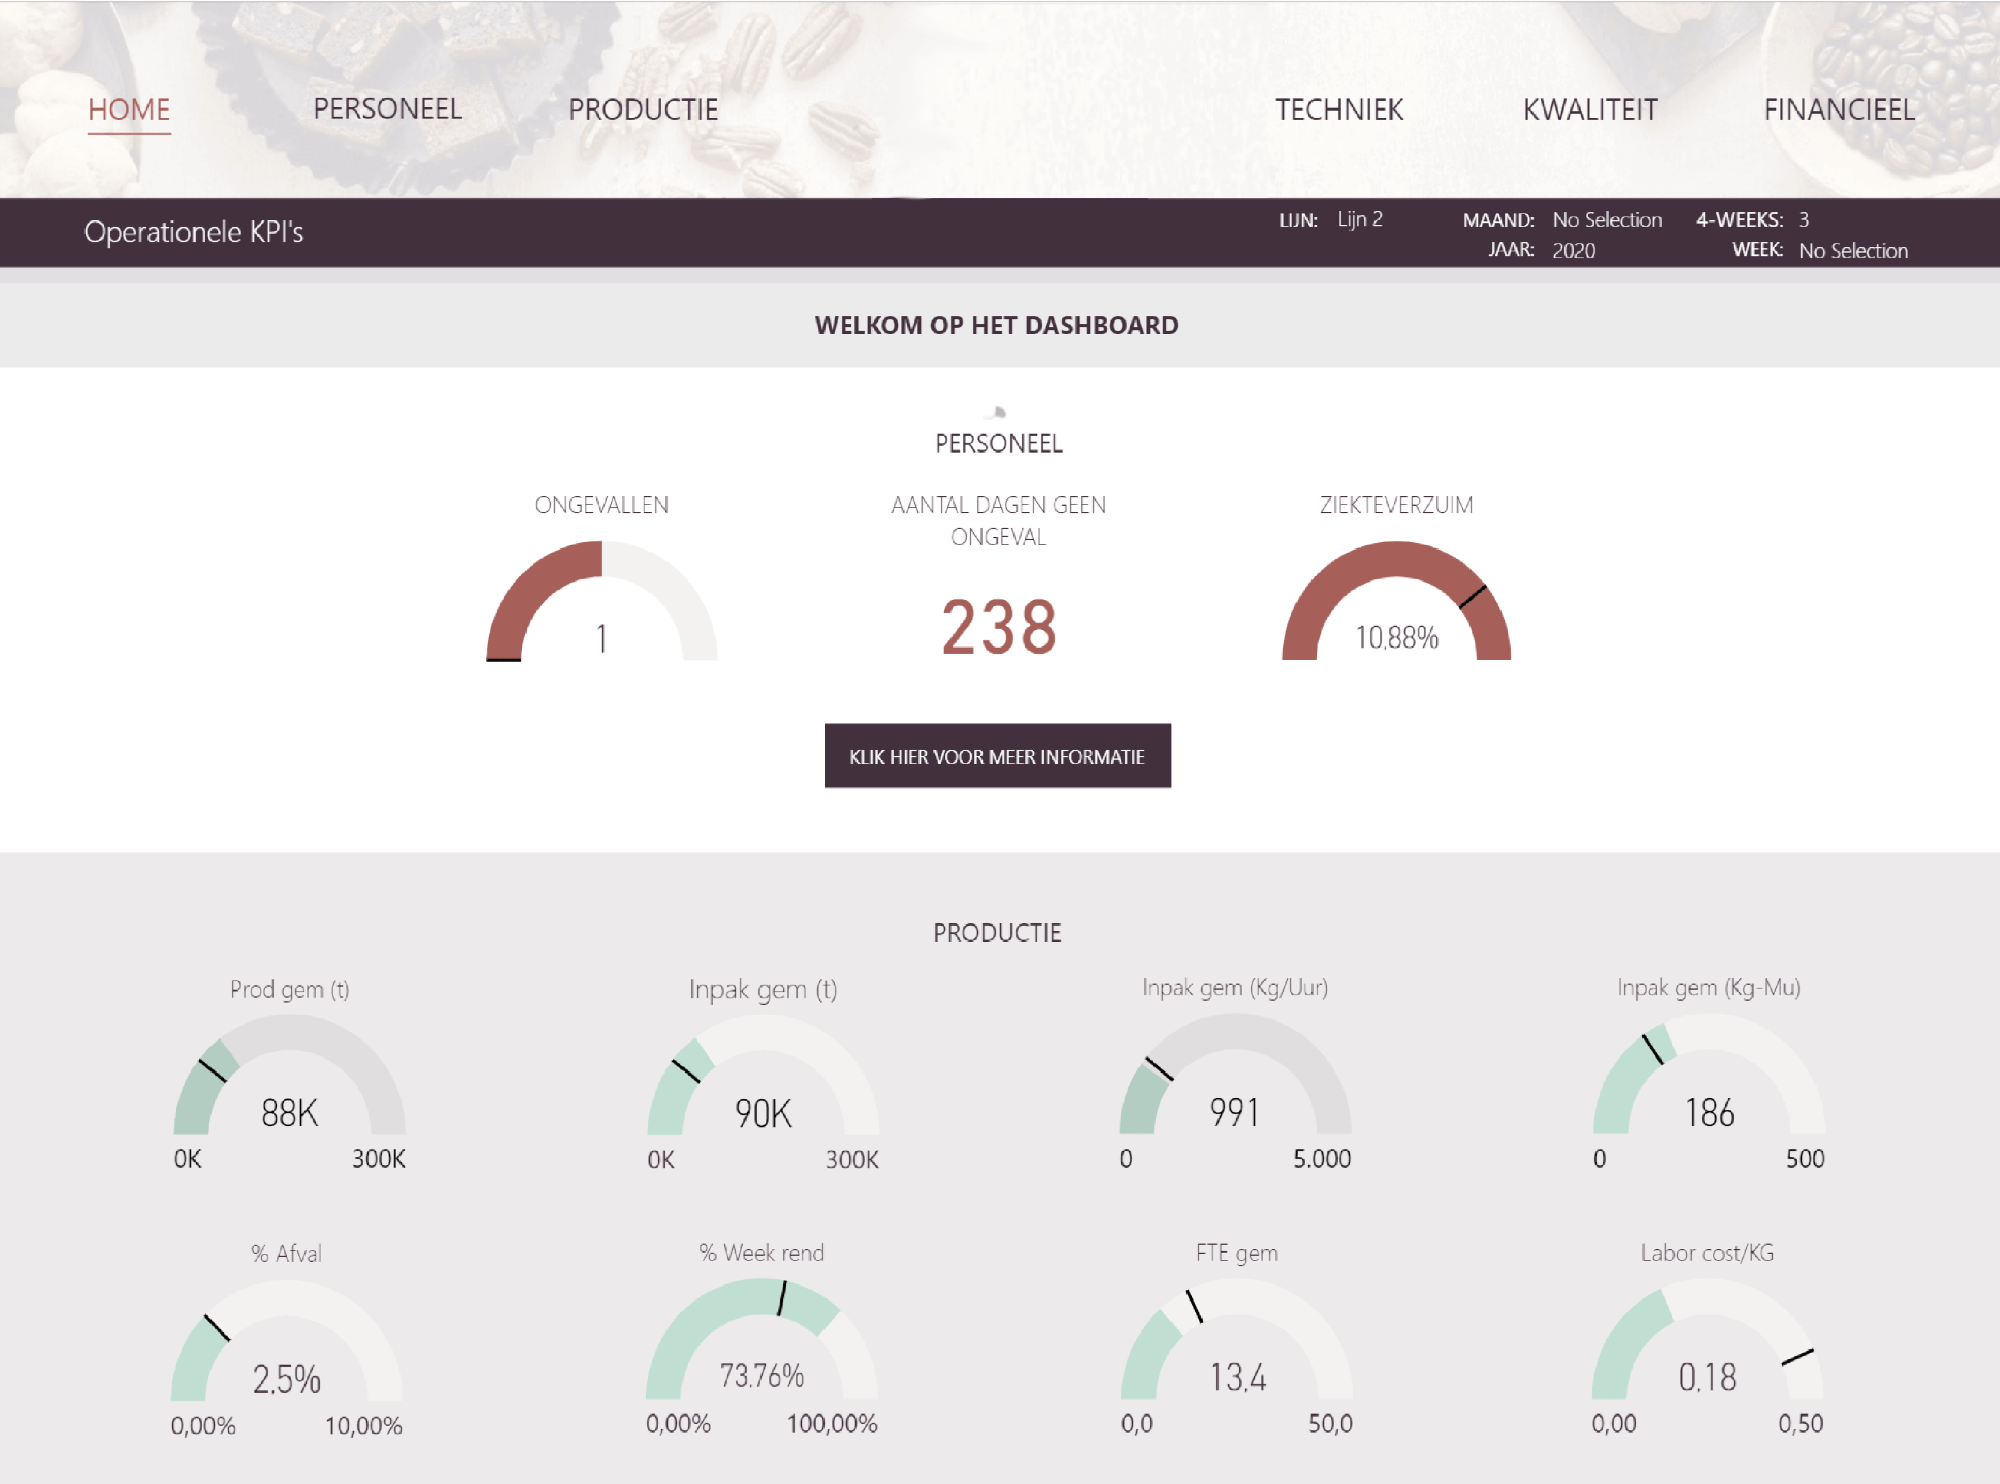 Figure 5: Example of a Business Intelligence dashboard from the food industry.
Request a quote for a BI dashboard
Housing corporation
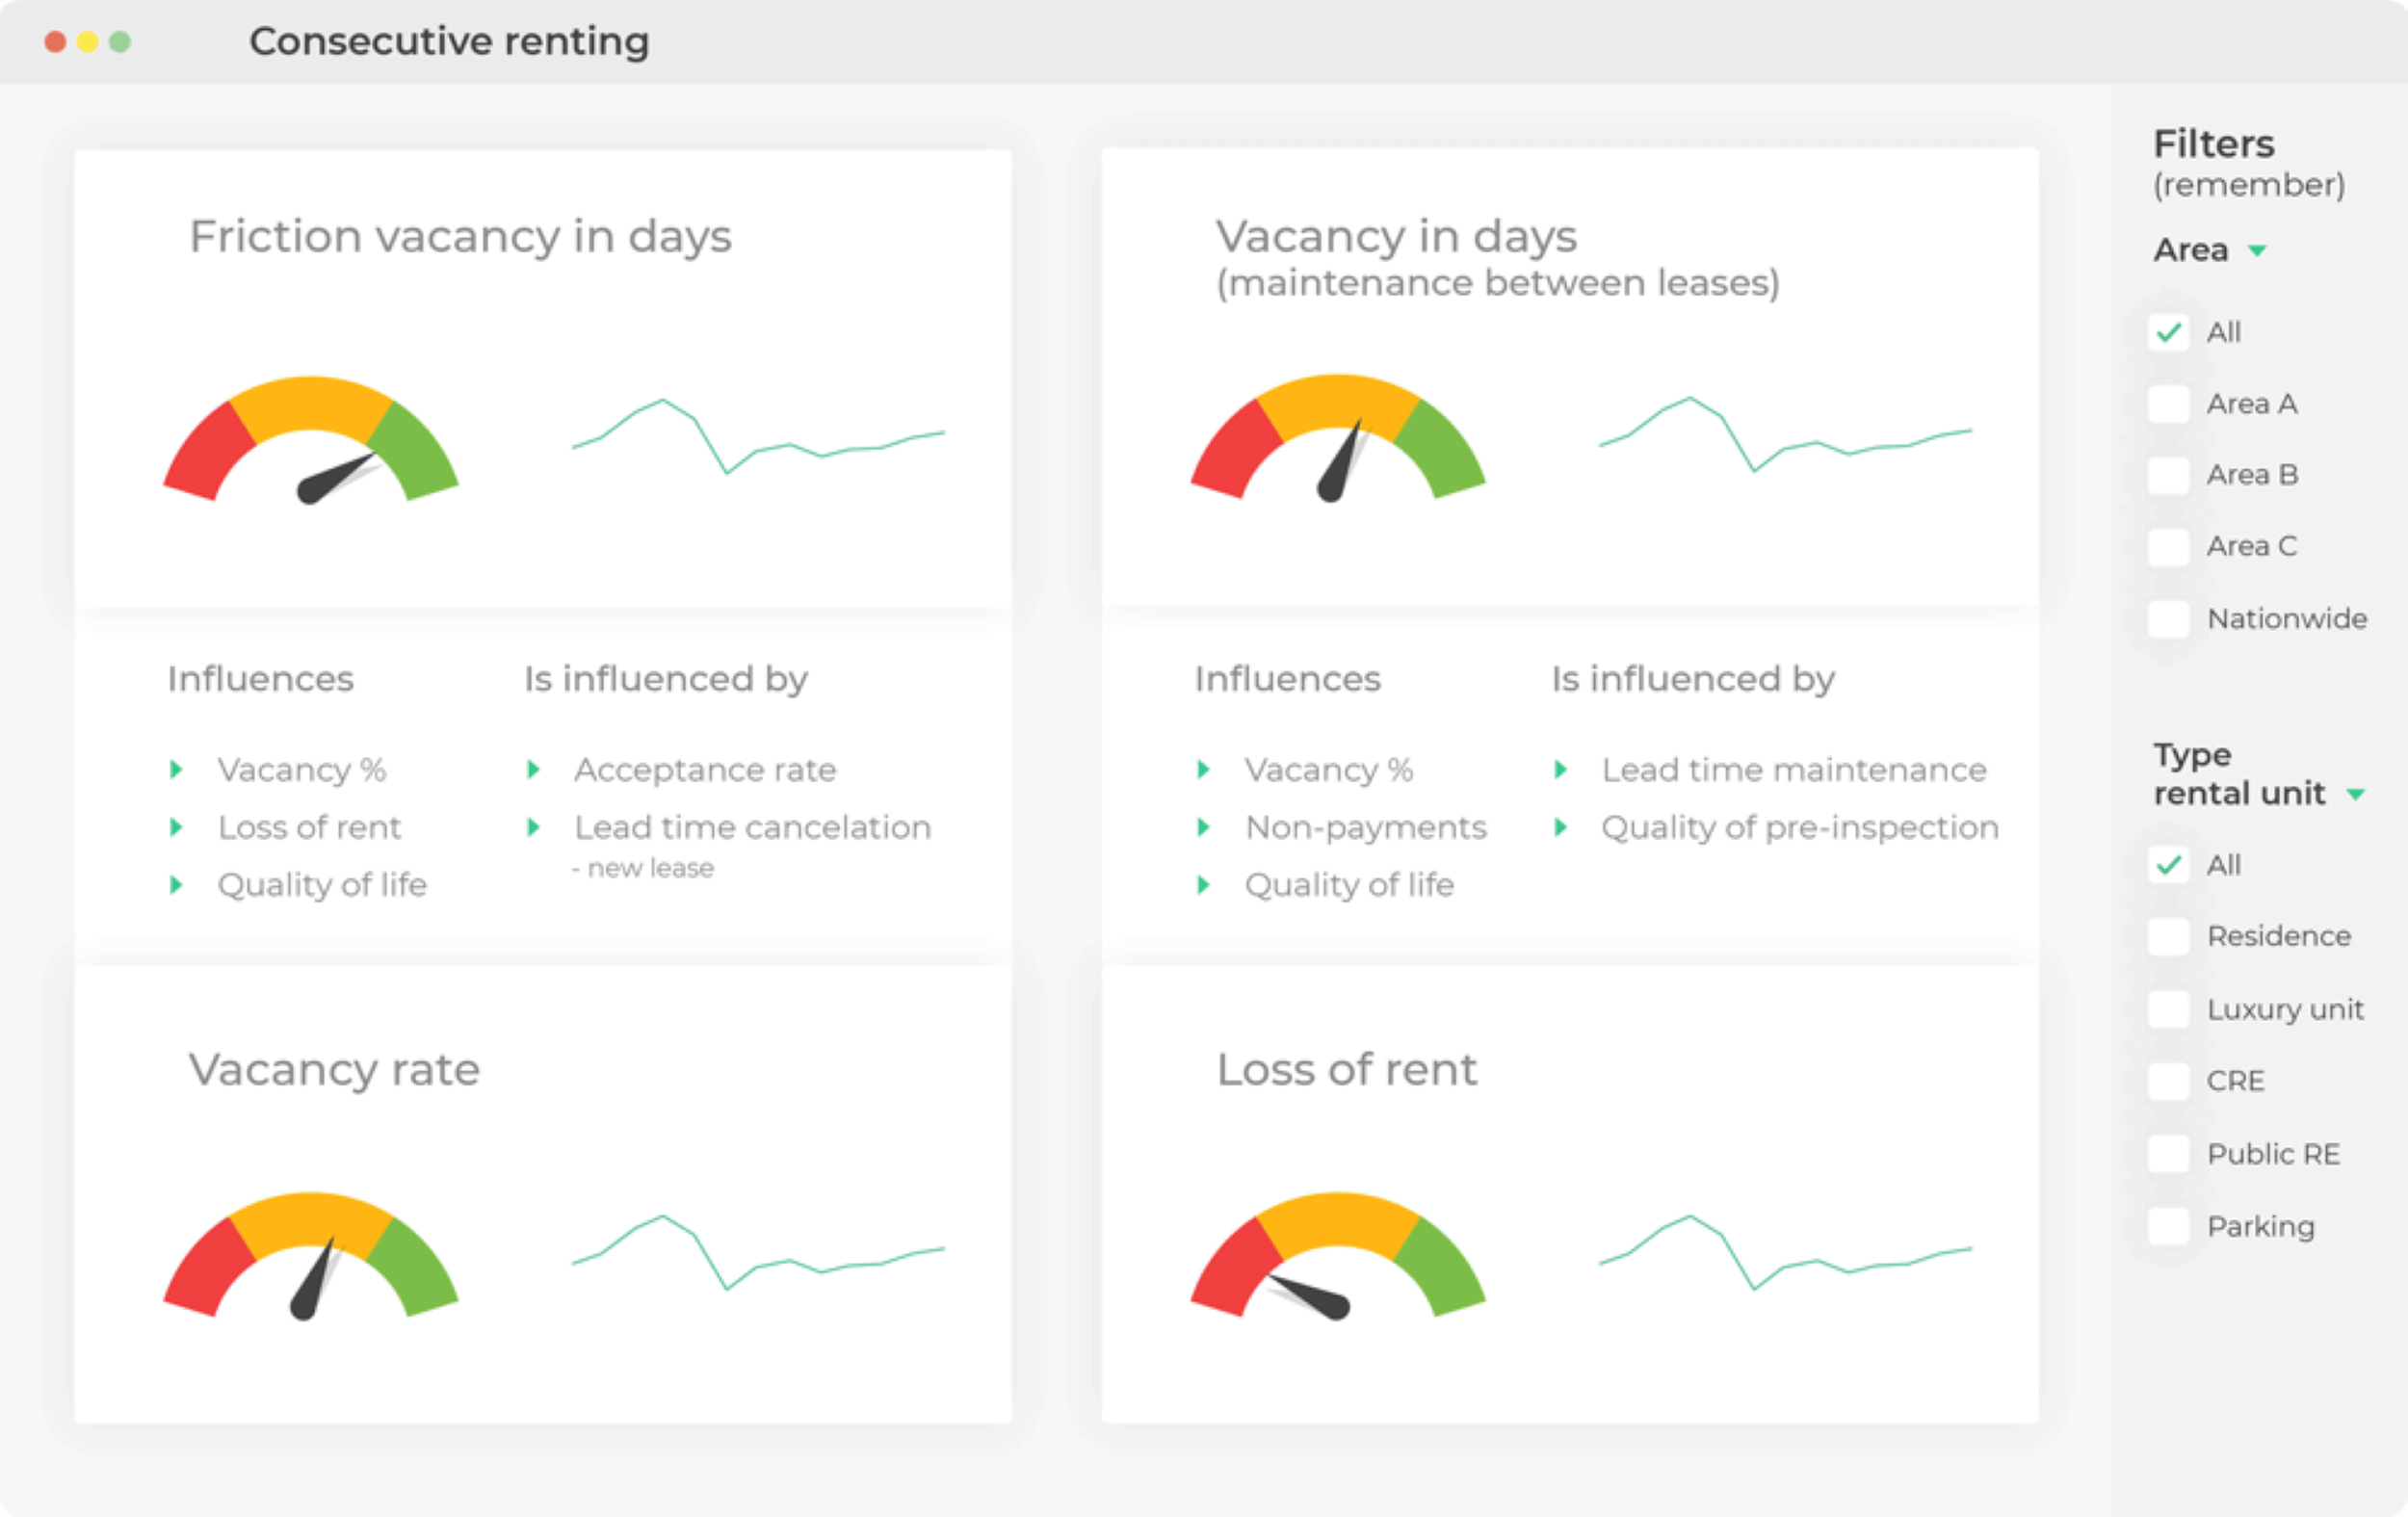 Figure 6: Example of a BI dashboard from the real estate industry.
Provincial government
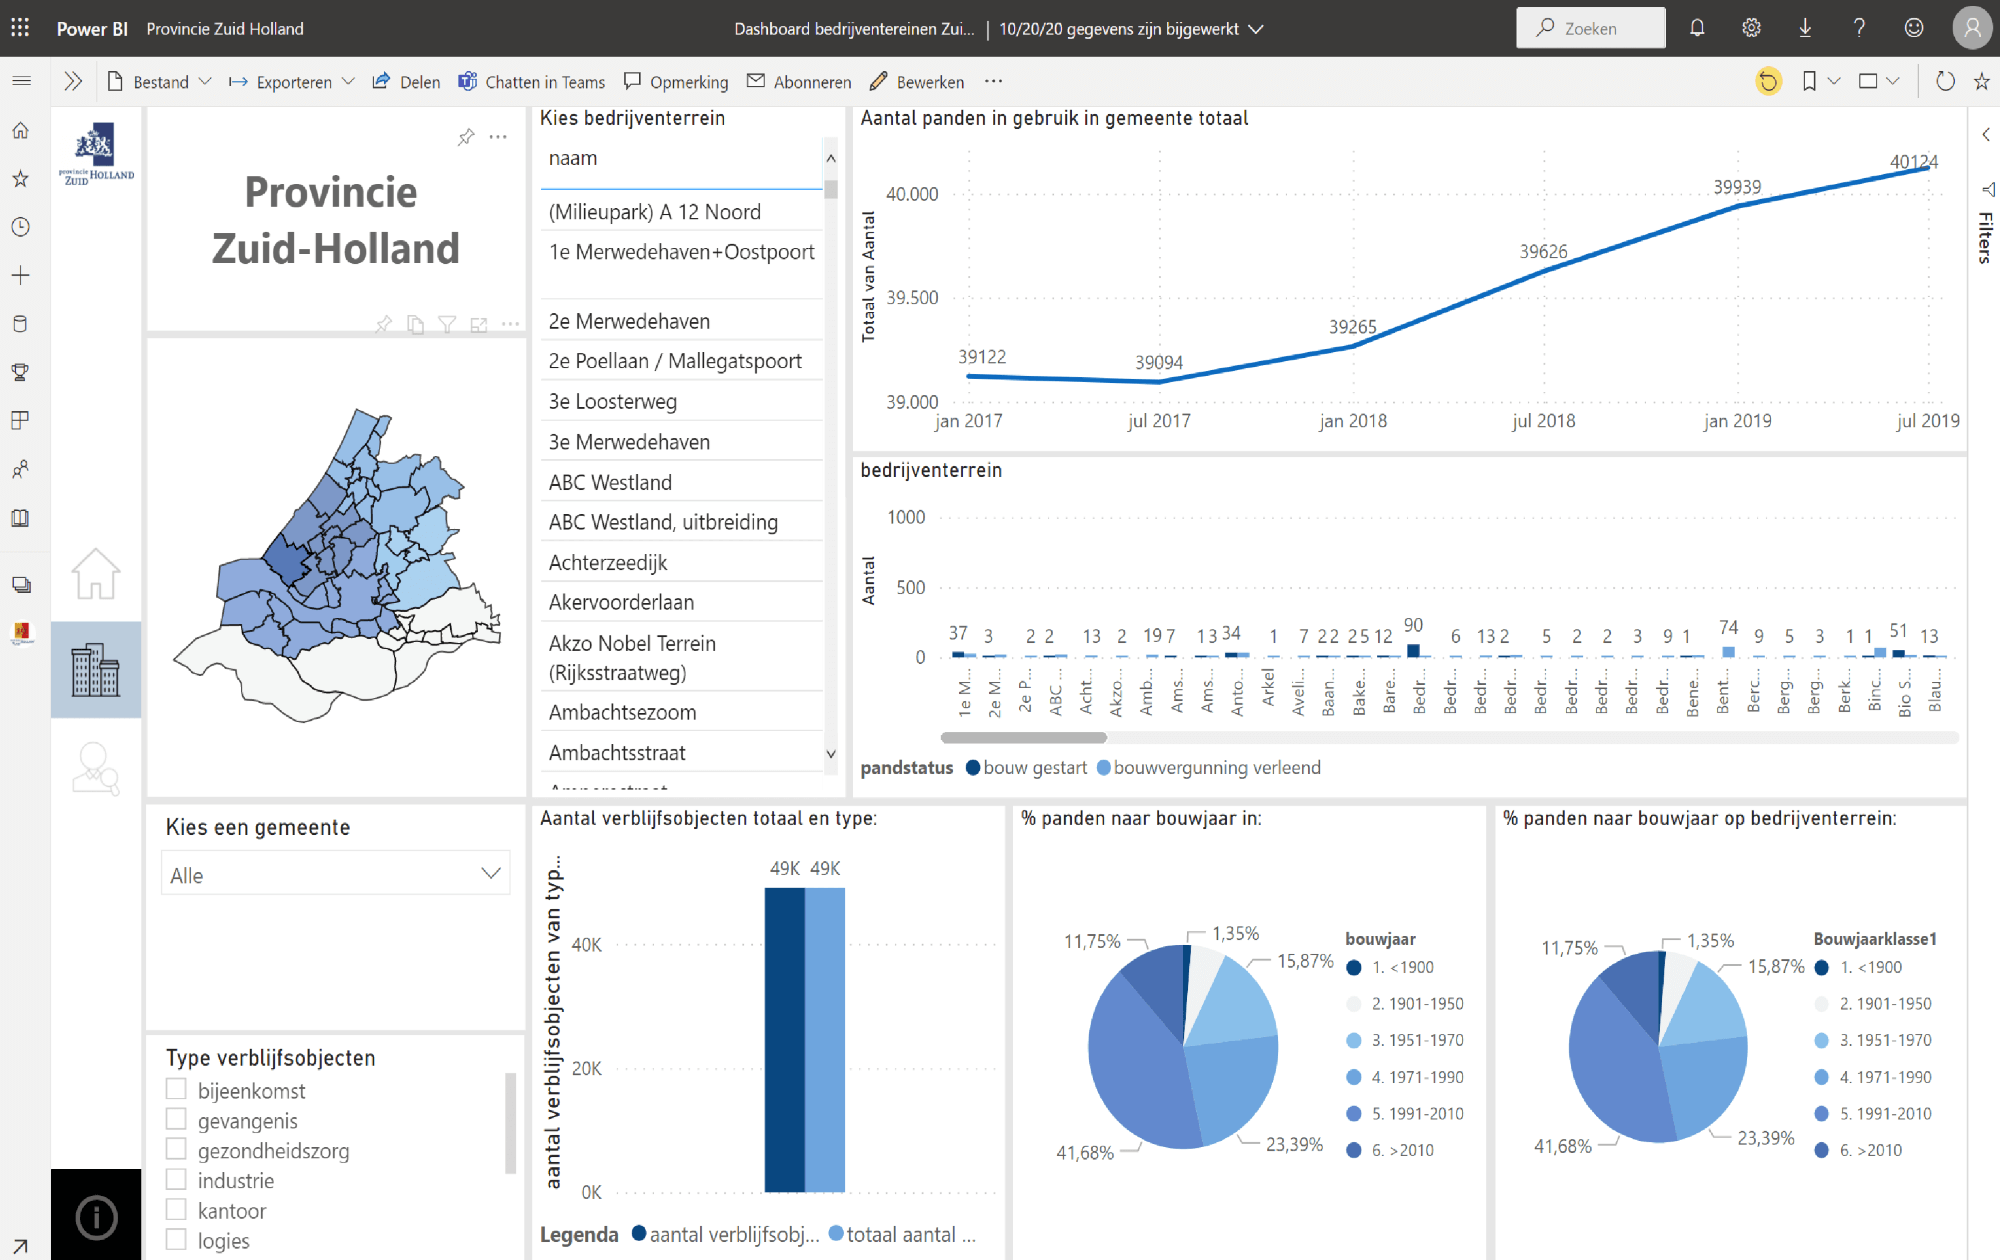 Figure 7: Example of a BI dashboard developed for a province.
Youth Care
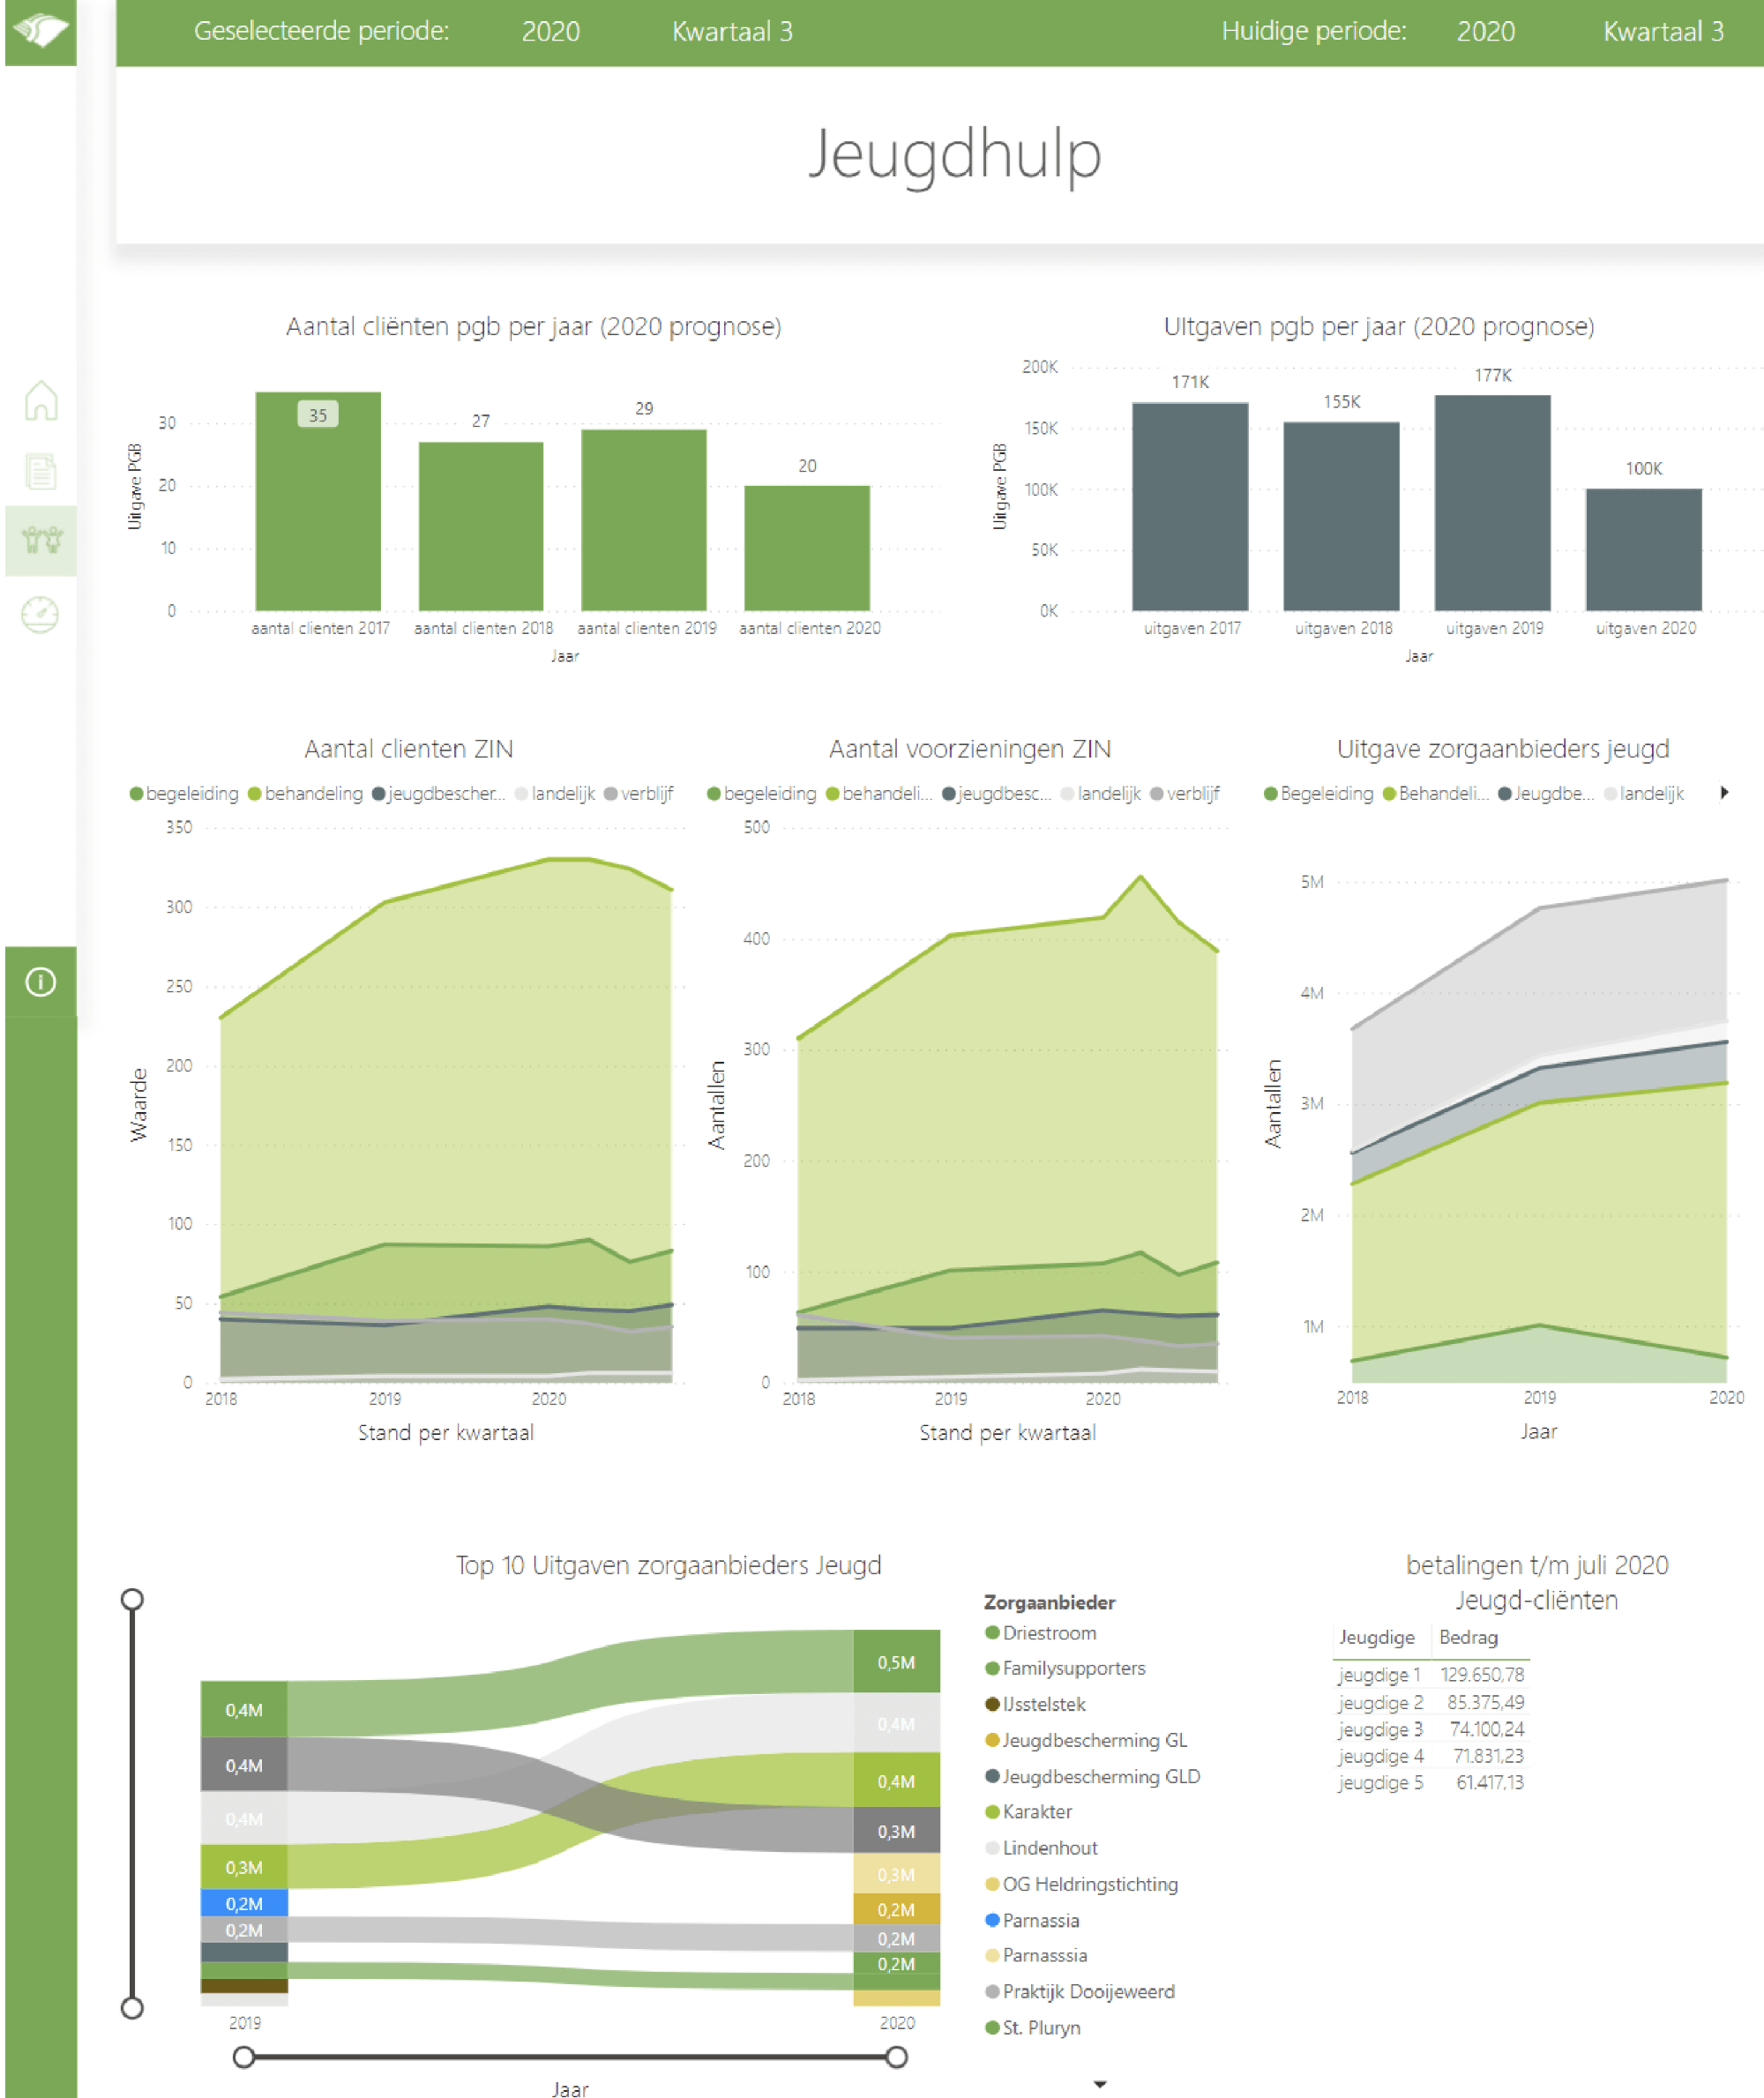 Figure 8: Example of a BI dashboard from a municipality that provides youth services
Do you also want to improve decisions and optimize processes with BI dashboards? Then get in touch with us now.
Which data sources can you get started with?
To build good reports, analyses, and dashboards you need reliable data. But where do you get that from? What are the most common data sources you can use as input for BI?
- Internal company data: retrieve data from systems such as SAP, Microsoft Dynamics, Oracle, AFAS, etc. You usually retrieve this data via ODBC links.
- Social media data: monitor and analyze trends or sentiments on Twitter, Instagram, Facebook, and Mastodont. You usually retrieve this data using a REST API.
- Open Data from the government: Data.gov
- Open Data from commercial parties: Chamber of Commerce, AC Nielsen.
- Web Data: contains data about visitors to your website and how they use it.
- Zero Data: data that you do not record but which, in combination with other data, can generate very valuable insights. For example, you can quickly see what your customers didn’t buy.
- Dark Data: data that is not or has never been used in a BI system or data warehouse but can be very valuable. Read more about Dark Data here.
- Big Data: unstructured data such as photos, emails, documents, or videos, or ephemeral data such as sensor data. This often also involves very large amounts of data. Read more about Big Data Analytics here.
Complete list of Business Intelligence tools
Excel is free but we do not recommend using it for Business Intelligence. It is too error-prone, poorly secured, and runs far too slowly. If you want to achieve success with Business Intelligence, you need professional tools. These tools automate the BI process from data collection to visualization. Use the list of BI tools below to get your bearings:
Want to know exactly what the pros and cons of the different tools are? Then check out our 100% independent BI & Analytics Guide 2024 here.
The 7 comprehensive benefits of Business Intelligence
We have been working in the BI field for more than 20 years and have successfully guided and executed more than hundreds of implementations. All the features and benefits of Business Intelligence are strongly in our memory. They are listed below:
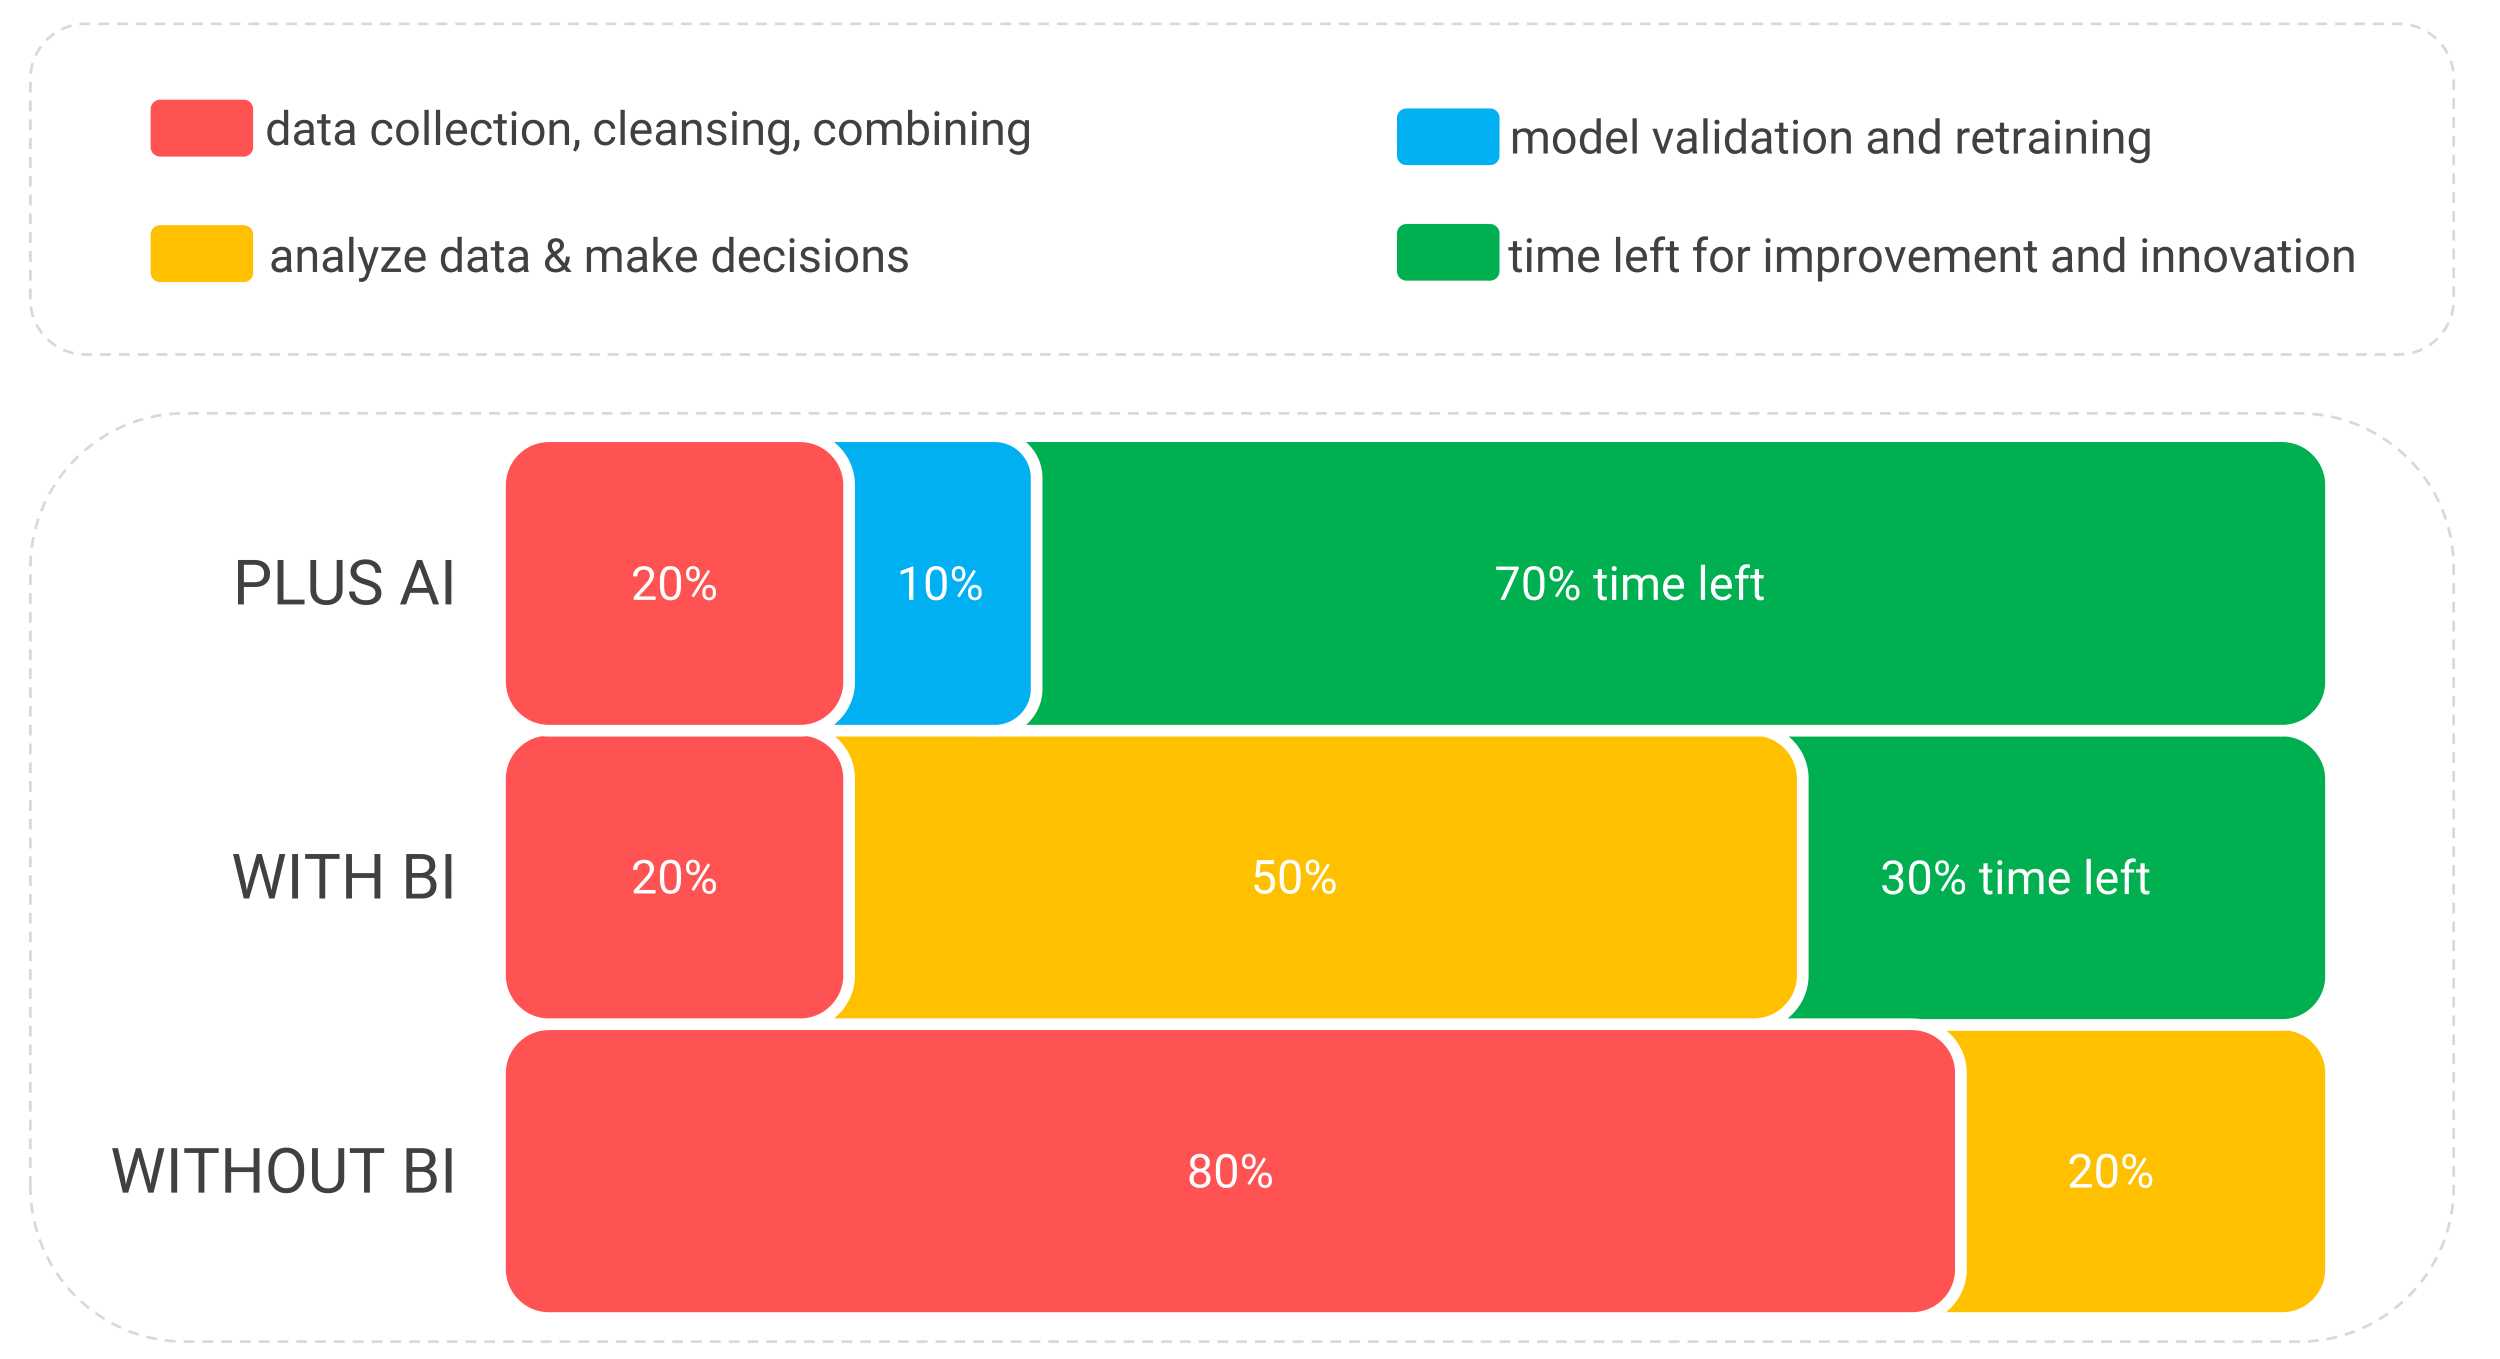 Figure 9: The single biggest advantage of Business Intelligence is that you spend much less time collecting, cleaning and combining data each time. Through Artificial Intelligence (AI), you also automate the analysis function in your organization. The time savings are then even greater.
- EFFICIENCY: You spend much less time finding, collecting, cleaning, combining, and analyzing data from different systems. See the big difference between “Without BI” and “With BI” in Figure 9. So Business Intelligence provides a very efficient process for turning data into insight. And you can’t do that with Excel.
- EFFECTIVENESS: BI helps you make much better decisions on all kinds of levels and areas in your organization. With Business Intelligence you have a more integral insight into the process flow, performance, patterns, and interrelationships. You gain highly refined knowledge faster and improve results.
- EVEN MORE KNOWLEDGE: You have much more time for (advanced) data analysis, which is the heart of Business Intelligence. You are going to create a knowledge factory instead of a report factory. See our article “Without data analysis, BI is pointless”.
- ONE VERSION OF THE TRUTH: Much less time will eventually be lost in recurring discussions about definitions. With BI, you are going to create unified definitions and create one version of the truth. Everyone can speak the same language so everyone will be on the same page. How do you define revenue? What is our margin? How do we calculate lead time? What is a customer? That’s all captured in BI.
- TRANSITION TO AI BEING SIMPLE: You make the transition to AI and algorithms easier with Business Intelligence. This allows you to automate and start predicting decisions. BI is the foundation for AI and machine learning.
- BETTER DATA MANAGEMENT: With BI, your information management and data management are going to improve. No more jumble of spreadsheets, files, CSV files, etc. You will work with one BI system that creates order out of chaos.
- STRENGTHEN YOUR BUSINESS MODEL: With Business Intelligence you can monitor everything, link and compare all data (if your keys are correct). Analyze everything that is loose and can be of value. You will gain so much new knowledge and insights that it will help to get a better view of your performance and especially how that performance comes about. Improve and refine your strategy and business model with BI & data-driven work.
Check which of the above 7 points your organization scores well on. Contact us if you want to score on many more benefits with BI.
What are the main pitfalls of BI?
The road to a successful BI application is littered with obstacles and pitfalls. Consider the following challenges and risks:
- The BI team is technically very good, but they don’t know anything about the business. And that is crucial to achieving success with Business Intelligence.
- The KPIs are not sharp or always provoke discussion. Monitoring and analyzing the score on KPIs is the heart of BI. If the KPIs are not sharp, the business model is also vague and you cannot set up good data analyses. The result: no steering for improvements.
- BI has become a report factory. Be careful not to create too many reports, before you know it you are stuck with a report factory. Some organizations produce as many as 1,000 reports, which is uncontrollable.
- There is a technology push. The result is resistance from users who don’t use the BI dashboards and don’t open the reports and analyses, let alone read them. Develop BI together with the users. Every euro that you invest in technology you should also invest in people.
- No (quick) access to data or poor data quality. First, perform a data quality scan so that you gain insight into the data quality. Don’t present your first report and dashboard as the ultimate truth, but test the outcomes against each other.
- Decisions get buried. Don’t lose sight of the decisions. The ultimate goal of BI is to make better decisions. When developing BI dashboards and applications, use the aforementioned decision diagram. Don’t stare blindly at the data.
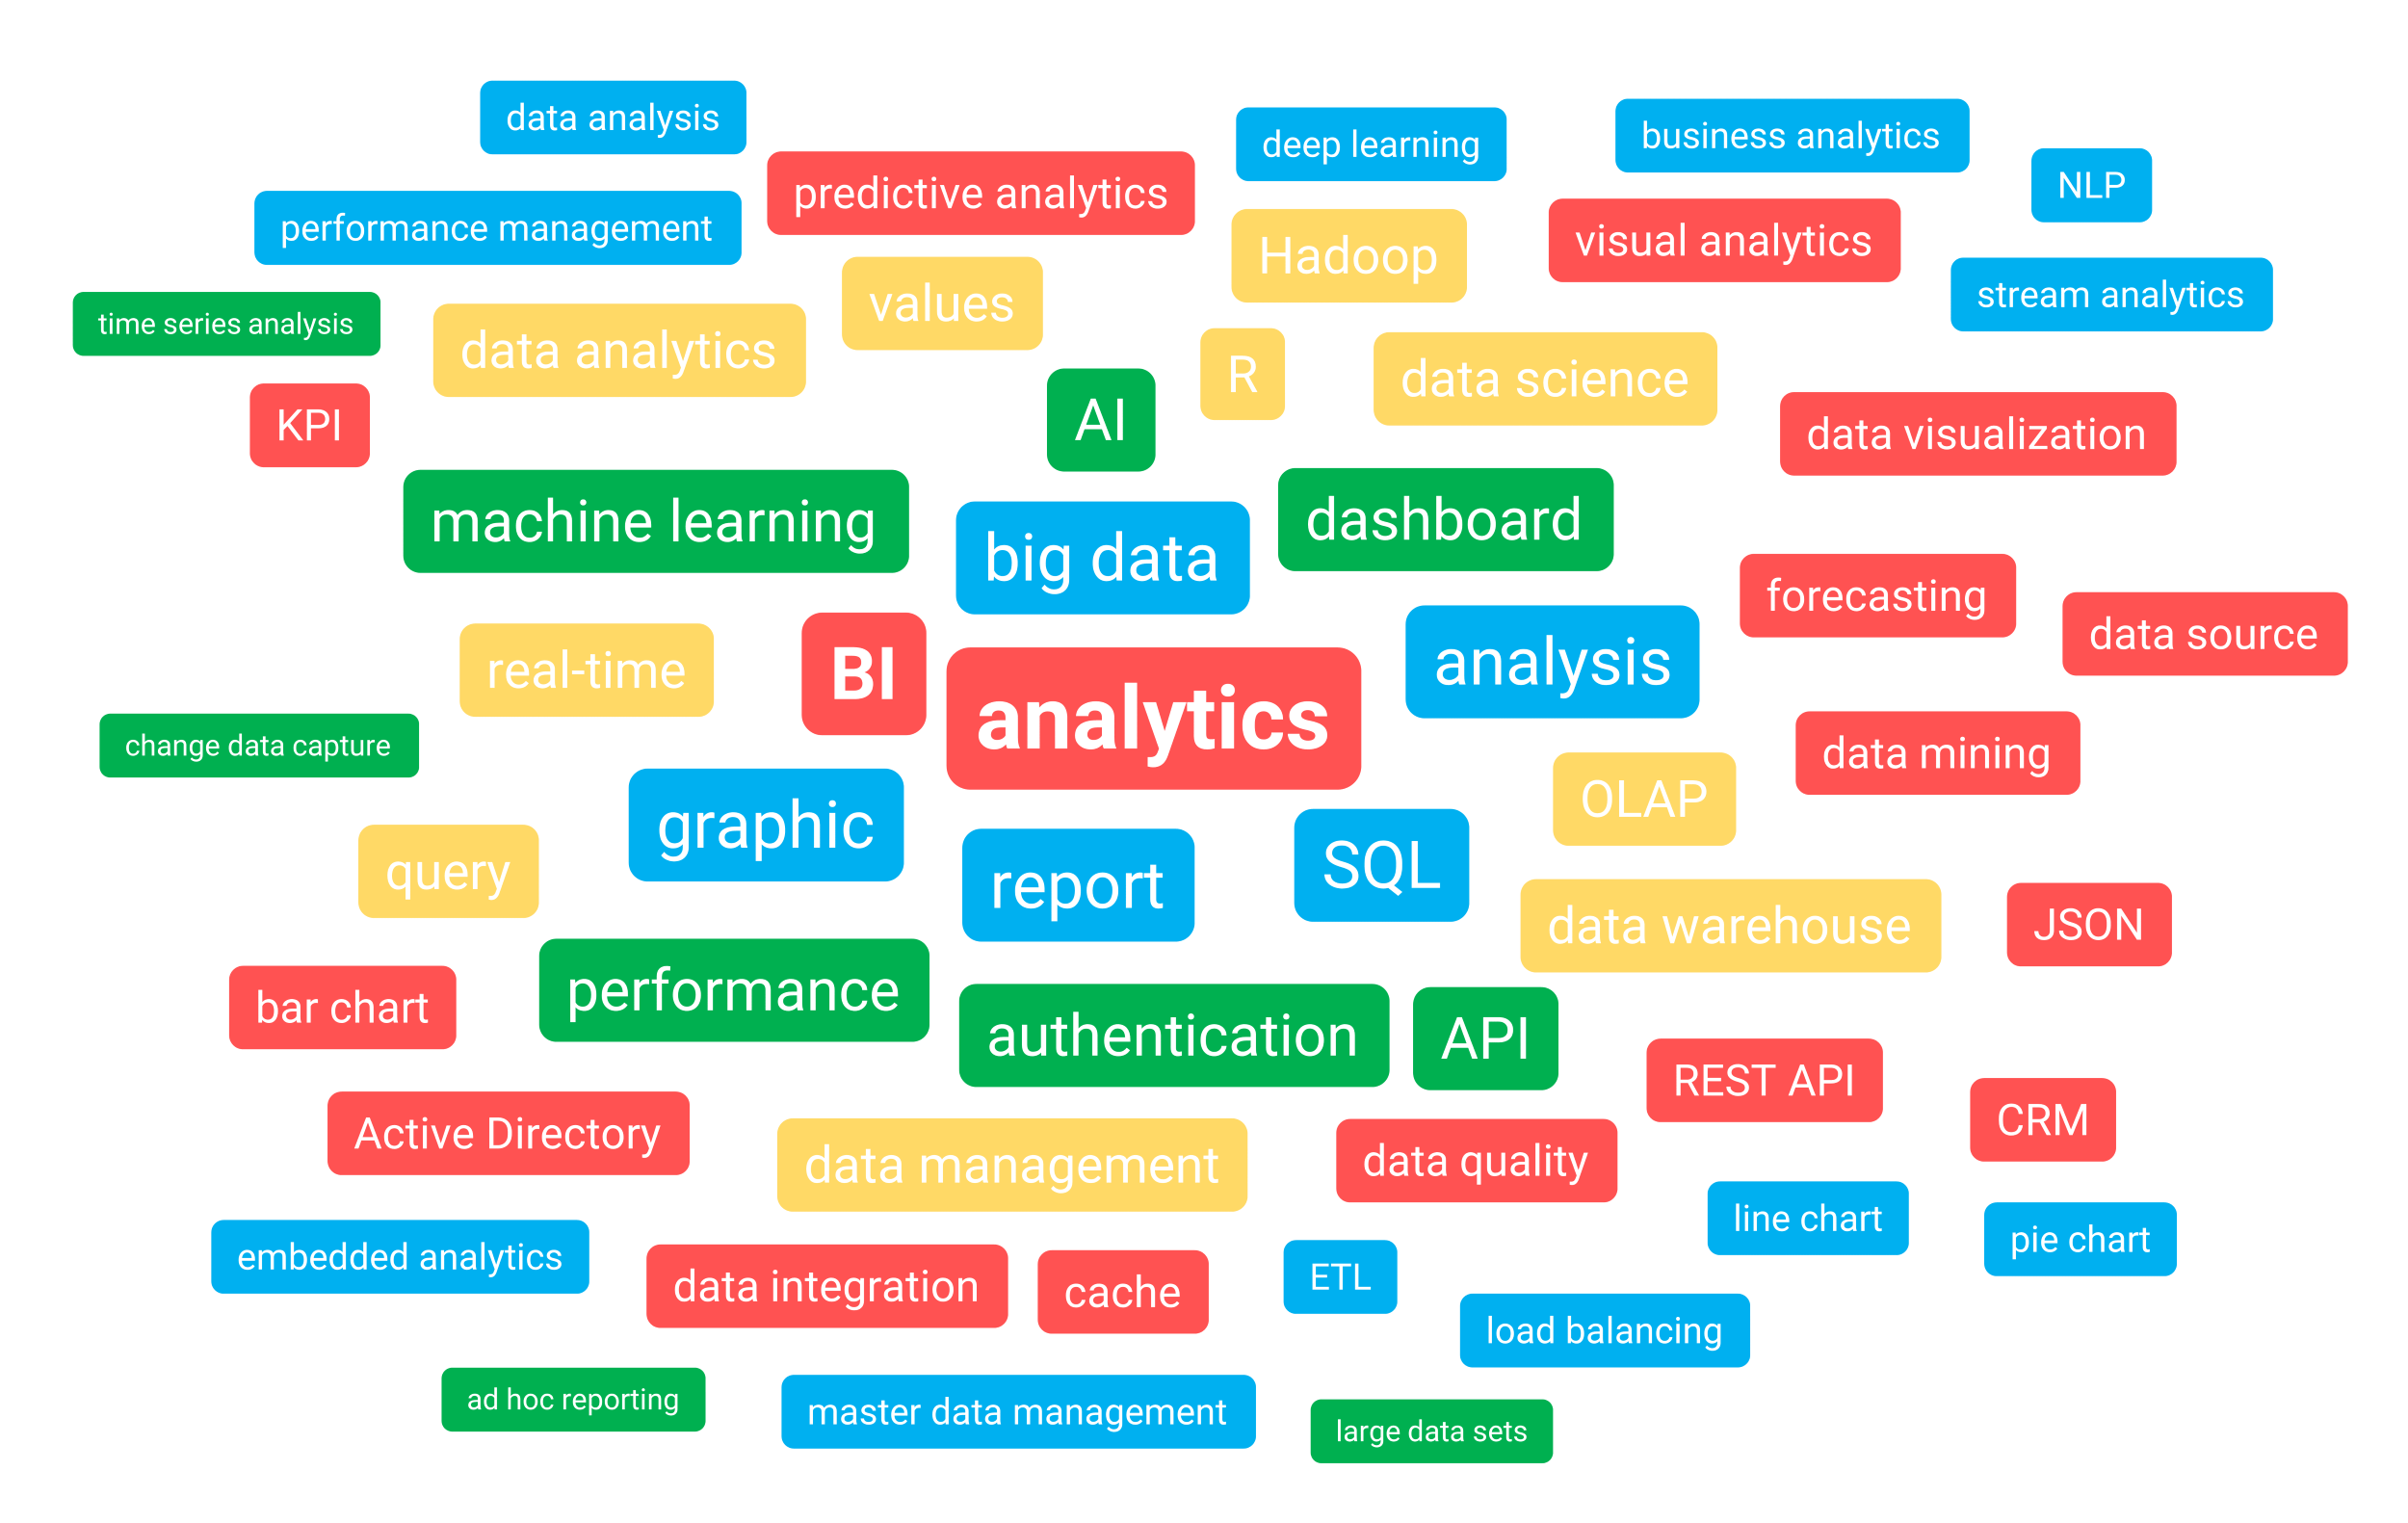 Figure 10: Through our own AI knowledge platform, we investigated which terms are more or less related to BI & Analytics. More than 500,000 documents were analyzed for this purpose.
- Misunderstandings and too little knowledge of BI in the team and organization. As a result, BI does not reach maturity, you get stuck in creating reports. By the way, you can prevent this quite easily with good books, training, and inspiration sessions.
- The business does not care or get involved in BI & Analytics. A consequence of the aforementioned point. Make sure you involve the business closely from the very beginning.
- No integral direction. The fields of Data Science, Artificial Intelligence, and Big Data do not fall under the direction of the BI department. The result is a huge fragmentation of all kinds of initiatives.
- Management sees BI as an IT product. This will lead to Business Intelligence becoming technology-driven and quickly foundering.
- Business Intelligence is fragmented in the organization. No direction and integral vision have been developed on the possibilities and applications of BI in one’s own organization. Every successful journey begins with establishing a shared vision of Business Intelligence.
- You are not given enough space and money to experiment. BI is a journey of discovery that you make together. There is no highway to success. Sometimes you have to take a turn and take the country road, and sometimes you have to drive back a bit.
- BI is not linked to or even disconnected from continuous improvement and innovation. The success of BI is closely related to these. See the next paragraph.
The key success factors of BI (research) – the data-driven PDCA
What determines the success of Business Intelligence has nothing to do with which BI software you use. This emerges from our large BI survey in which 369 organizations participated. The following factors are determinant for the success of BI:
- PLAN: Set clear standards and targets for your KPIs and formulate them SMART: specific, measurable, acceptable, realistic, and time-bound.
- DO: Implement the plan, monitor and analyze the KPIs and underlying data, then dive deeper and focus on deviations from the norm.
- CHECK: discuss with each other the results both positive and negative. Hold a data dialogue with each other and give each other feedback. Let different opinions clash and learn from each other.
- ACTUALIZE: regularly evaluate the standards and targets and adjust them as needed. Or arrange for the execution to have more or less resources so that you can still meet the standard. By regular we mean weekly or monthly.
So Dr. Deming’s famous circle (PDCA) turns out to be very important to achieving success with BI. Do you really want to have success? Then link continuous improvement to Business Intelligence.
The above success factors also assume that you have already established pure KPIs. Hold your KPIs against the light with our SMART KPI toolkit 2024. See also our Data Science Book.
The 101 steps to Business Intelligence success
Achieving success with Business Intelligence does not come easy. It is not a matter of luck. Rather, it requires a process of meticulous engineering. Step by step, you build and expand success. These are the steps to lasting Business Intelligence success, and this is how you develop an intelligent, data-driven organization:
- Understand BI & data-driven work yourself: make sure you build up ample knowledge and experience with BI dashboards, reports, data warehouses, machine learning, KPIs, decisions, etc.
- Let others understand BI too: make sure that you gather enough supporters within the organization who also have or want to build up that knowledge and experience.
- Create a prototype: download one of the BI tools, collect relevant data and build your first BI dashboard with interactive capabilities. Go public with the data and your dashboard.
- Increase awareness: with all the knowledge that you and your colleagues now have (and the prototype) you are going to increase awareness of the possibilities and benefits of Business Intelligence. Especially among decision-makers in the operational process and management. Consider inspiration sessions, interviews, demos of the prototype, and working workshops.
- Assemble a BI working group: identify all stakeholders and future users in the organization now and select a number of people from that group for the BI working group. Get Finance & control and IT on board and able to think along.
- Scan your IT vendor contracts: in some contracts, vendors prohibit direct access to your own data. This can be a major roadblock to the further development of Business Intelligence. Make sure the barriers to data access are removed.
- Write a vision document: have the working group develop a common vision for the overall field. Make sure that all members of the working group are aware of the vision (with concrete applications and all) and that they can explain and propagate it themselves.
- Management approval: present the vision to management and other important stakeholders. Make sure that management approves the vision document.
- Map decisions integrally: using the decision diagram, start mapping all the important (operational) decisions in the primary process. These are your use cases. Focus on the outline here but for each decision try to work out all the cubes as best as you can.
- Define key KPIs: after you have a good understanding of the key decisions, you can easily retrieve and further define the KPIs. Align these with the Finance & Control team.
- Prioritize decisions and KPIs: together with key stakeholders and management, you are going to prioritize decisions and KPIs. Ideally, you are going to optimize those decisions that also contribute (significantly) to the business strategy.
- Select the most important decision and KPIs: following the previous step, you let the board make a decision on which decision should be supported first by a Business Intelligence dashboard or BI system.
- The board appoints a delegated principal: the board has a delegated principal represent itself operationally for that specific decision, who is also the BI Product Owner.
- Assemble a project team: in consultation with the Product Owner, assemble a project team that includes a data engineer, a BI consultant/dashboard developer/report builder, a data analyst, and a data coach. Appoint a project leader.
- Write the business case including the project plan: describe and visualize what you are going to do (activities), with whom (roles), how much time it will take (WBS), what are the goals you want to achieve, what risks there are and what measures to take against them.
- Organize a kick-off: with the project team and key stakeholders, organize a kick-off meeting so that everyone is up to date on the latest developments. Present the project plan, and ask for feedback.
- Get the project plan approved: IT, Finance & Control, and the delegated client should approve the project plan.
- Communicate the project to the organization: have the Product Owner communicate the project to the organization/department. Focus on those directly involved but don’t forget to keep key stakeholders in the loop.
- Create a functional design: describe what you are going to achieve in as much detail as possible. Don’t forget to define the KPIs and PIs including what data sources you need to calculate them.
- Create a dashboard mock-up: sketch in broad outline what the future dashboard might look like. This is part of your functional design.
- Sketch a dimensional model: now describe what you are going to achieve in a dimensional model with measurement values, dimensions including hierarchies, and any linking tables and filters. This model is part of your functional design.
- Make the design compliant with privacy laws if you have to deal with the processing of (sensitive) personal data, you have to seal off a number of things in your functional design. Privacy by design.
- Get the functional design approved: ask for feedback from the Product Owner and Finance & Control and get them to approve the design.
- Conduct a data quality review: poor data quality should be known to all project team members and the Product Owner. Escalate major problems through the Product Owner to the process owner. If necessary, start a parallel improvement project to raise data quality.
- Outline the project initial architecture: name all relevant principles for the project’s initial architecture and describe the components needed to achieve the project result. Only in follow-up projects, should you start thinking about a complete BI architecture.
- Get the architecture agreed upon: Have IT together with the Product Owner approve the architecture. This will prevent problems later on.
- Choose the right BI tooling: Don’t be overwhelmed by the dominant market position of Microsoft Power BI, but choose the tool or BI platform that best fits your organization’s needs and requirements. Check out our BI buyer’s guide here [year].
- Organize a button training: Organize a button training for the BI tool for your BI team, a few people from IT, and some future users.
- Visit the client: book an informal meeting with the client (board member) and tell them what you have encountered so far in terms of resistance, enthusiasm, setbacks, and windfalls. Do this together with the Product Owner.
- Unlock the data sources: let IT, under the direction of the data engineer, unlock the data sources. At least make sure you have a copy of the tables you think you need on another server.
- Provide daily updates: idem, make sure the (changed) data of the previous day is ready overnight. Real-time updates are usually a bridge too far at this stage unless the business case clearly demonstrates that this is absolutely necessary.
- Explore the data: have the data engineer explore the data together with the data analyst. This way you quickly find out where possible problems may arise in terms of data quality, data linking, etc.
- Model the data: now the data engineer can go all out on your data. They are going to put together a data model that is as robust and future-proof as possible. But for now with the scope being the current decision. In this step, the data model for the customer and product dimension must take into account a larger scope.
- Transform the data: after the updates come in, the data engineer ensures through ETL processes that the data model is updated every night. You also add important formulas for calculating KPIs.
- Test the data model: have a future domain expert with SQL knowledge and experience (or an external data engineer) review and test the data model.
- Process the feedback: incorporate any omissions in the data model and other feedback from the test into the data model.
- Design the dashboard & visualizations: now the data analyst / BI consultant can get to work retrieving the right data from the data model to visualize the KPIs on a dashboard.
- Add interactive elements: make the Business Intelligence dashboard interactive including drill-down capabilities so users can browse and analyze the data.
- Add reports for details: develop detail reports that allow users to take appropriate actions. For example, a report that shows items below the minimum stock level.
- Present the dashboard: host a meeting where you show and explain the dashboard to users. Ask for feedback. Also, show what the back end of a dashboard entails so they understand that it is not all simple.
- Have the dashboard validated: have some (critical) users validate the dashboard. Are the numbers correct? Is the design logical? Is it easy to use? Etc.
- Keep IT in the loop: make sure you keep IT informed of developments regularly and early. After all, they need to start managing the data model and dashboard.
- Create a production environment: in consultation with the data engineer and the BI consultant, IT will ensure that a production environment is created. From here, users can access their dashboard daily/weekly and analyze the data.
- Set up authorizations: each user has a role in the business process. Set the authorizations depending on someone’s role. This way, users get to see directly what they are responsible for, and no one sees unauthorized data.
- Create a manual: document the desired usage in a compact manual (ideally online) or video instruction. Make sure that in this manual the definitions of the KPIs on the dashboard can also be consulted.
- Set up a service desk: under the direction of IT, set up a service desk where users can go when the dashboard does not work (as desired).
- Put the first dashboard live: process the feedback from users and IT, and package the dashboard and data model and implement it all on the production environment. Adjust the manual if necessary.
- Give all users button training: take your users through all the possibilities of the dashboard and the possible data analyses that can be performed. Differentiate here between managers (decision makers) and data analysts.
- Communicate the dashboard and data model: make sure that all users, stakeholders, and management are informed about the dashboard going live and its purpose.
- Be wary of criticism and resistance: with BI, the way that decisions are made in your organization will be more transparent. Don’t expect everyone to be waiting for this. Middle management in particular sometimes cannot handle this transition.
- Ensure support from management (again): you need a lot of support from management (they must be squarely behind you) otherwise some middle management people will downsize or even sabotage your project.
- Organize a party: this great moment should not be forgotten soon. Therefore, organize a party for stakeholders and all involved. Celebrate the first dashboard going live.
- Management on the soapbox: during the first act of the party, have a board member and someone from operations say why the dashboard is important: much better decisions through insight and data analysis. And not to maintain a culture of accountability.
- Organize training in data-driven working: perhaps the Achilles’ heel of the project is training and coaching the managers. They, along with the data analysts, must be brought into a natural flow to make data-driven decisions from now on. Data literacy must continue to rise. Request a quote here.
- Organize regular data sessions: either individually or in groups organize weekly or monthly data sessions where you link continuous improvement to the dashboards with KPIs and data analysis. Managers and team leaders should know all about PDCA and data-driven working.
- Link findings back to the client: together with the Product Owner, engage with the client and link back your findings so far. Where are things going well? Where is it going less well? How to adjust? What do you now expect from the client?
- Improve the dashboard: collect all feedback from the users and other stakeholders. Incorporate that into a modified data model and dashboard. Make this a continuous process in which the Product Owner directs.
- Appoint data coaches: the data coach helps decision-makers in the organization make data-driven decisions on a daily and weekly basis. A data coach also sometimes participates in meetings where decisions are made.
- Limit time and budget: let all of the above cost no more than 70,000 euros and take less than 4 months. These are averages and the actual cost depends on the amount of users, the amount of data, and the complexity of the decisions and the organization.
- Create a “lessons learned” document: from all the previous steps, you have learned a lot. Together with the Product Owners, draft a document summarizing the lessons learned.
- Repeat step 11: make another high-priority decision and then go through the necessary steps, keeping the lessons learned in mind. Do this in half the time and for half the previous budget. You will be able to skip steps. That way you won’t have to select a BI tool or adjust your architecture every time.
- Create data quality dashboards: the more data-driven decisions you start making, the greater the importance of clean, reliable data becomes. Therefore, start developing dashboards for each domain that allow process owners to monitor and analyze data quality.
- Appoint data stewards: the data steward works on behalf of the process owner to operationally resolve data quality issues. He or she also describes the key data of his or her domain and how to improve data stewardship.
- Jump from project to program: the time of separate projects is now over and you will work with the management to create a program “Data-driven working”. So there will be an overarching program for all BI projects.
- Transform the team into a department: the project team also needs an upgrade and a permanent place in the organization. Set up a BICC or data lab. Make sure there is a healthy mix of techies, domain experts, analysts, and social animals.
- Attend a Big Data or Data Science training: bring yourself and some colleagues up to speed on the specific capabilities of Big Data, machine learning, and AI.
- Develop an enterprise-wide data architecture: after a number of successful BI projects, your architecture is going to squeak and creak. Therefore, give your architecture an upgrade as well; first, design the new architecture on paper. Keep in mind the storage of Big Data and machine learning. This architecture must be scalable down the chain and be able to process data and more complex analysis super fast.
- Question the current tooling: previously you chose a specific BI tool but is it still suitable for the new architecture? This is where you revisit which BI tool or platform best suits your situation and organization.
- Agree on a new architecture with stakeholders: discuss the new architecture extensively with all stakeholders. Map out the impact in terms of budget and stability of the existing IT. Dare to go back on earlier choices.
- Monitor the use of BI: see how often users switch on BI. Talk to them when they use it frequently, but also when it is below expectations. You will learn from this.
- Ensure that data-driven working is the norm: before implementing the new architecture, you need to be sure that all layers of the organization are now working largely data-driven. Therefore, present the new organization and architecture to a large audience and gather feedback.
- Sharpen the previously established vision: update the vision document to include machine learning and present it to management, key stakeholders, and the various Product Owners, among others.
- Create a BI roadmap for the next 3 years: in a BI roadmap, address all BI needs of the organization (dashboarding, reports, downloads, external reporting, analytics, etc.) for the next few years including Big Data and machine learning applications.
- Present the BI roadmap and request budget: discuss the roadmap with all stakeholders and gather feedback. Adjust the roadmap, and resolve any disputes. Make sure you get sufficient budgets for all items in the BI roadmap.
- Migrate the dashboards and reports: you migrate the previously built dashboards and reports into the new data architecture. You do this with common sense so that you don’t transfer dashboards and reports that are no longer relevant.
- Replenish your BI team: at this stage of BI maturity, you not only need more people but also different expertise. More expert knowledge of new technology is needed and at the same time, you need more domain knowledge. Changing management expertise and experience is also very important.
- Start experimenting with machine learning: explore for yourself where machine learning can make a difference in your organization. Temporarily hire an experienced data scientist to help you get started. As a starting point, always make decisions in your organization, focus first on assessment processes in operations. For example, accepting a policy, appraising property, or granting a license.
- Select a language or tool for machine learning: there are several languages and tools that you can use to start developing machine learning algorithms. Consider not only Python and R but also other libraries and tools such as Scikit Learn, TensorFlow, SAS, etc.
- Develop a machine learning prototype : just like in the beginning with BI dashboarding (what steps you have already taken!) you need a prototype. This is where you go back to farming.
- Name the difference between BI and AI: Business Intelligence is an umbrella term that also includes machine learning and AI. With Artificial Intelligence, you automate the analyses that were previously done by humans. It also allows you to automate possible decisions. Explain this principle to key stakeholders.
- Work out the machine learning applications: based on the decision diagrams drawn up earlier, in workshops with domain experts you will look at how to apply machine learning to the decisions. Pay extra attention to big data and external data, such as weather, demographic data, and how to use machine learning to differentiate decisions in detail. Contact us for an explanation.
- Present and prioritize the machine learning applications: in a working group you will jointly go through and prioritize the machine learning applications under the guidance of the Product Owners and a member of management. As with dashboarding, you should select one decision at the beginning that you want to apply machine learning to.
- Develop a vision for AI: complete the aforementioned vision document with all the possibilities that exist for machine learning. In doing so, also consider: the more algorithms you develop and implement, the fewer reports and dashboards are needed. And also fewer managers.
- Explore the social impact: the organization can become even flatter through successful AI and basically fewer people are needed to do the same work. Get the implications clear, and discuss them with Product Owners and management.
- Make machine learning compliant with privacy laws: these days there is a wind blowing through AI-land where you have to be very careful with personal data and algorithms. And rightly so. Make sure your algorithms stay within the legal frameworks.
- Don’t forget AI ethics: all kinds of ethical dilemmas are around the corner if you want to apply Artificial Intelligence. For example, as an insurer, are you allowed to use AI at the gate to select for possible profitability of an insured? Discuss AI ethics with your key stakeholders and formulate the limits or substantiate AI applications with arguments as to why it is ethical.
- Raise additional budget for AI: You will likely need additional budget to successfully implement AI. Work with the Product Owner to establish a business case for this particular AI application.
- Explore your data needed for AI: before you use machine learning to support or automate a decision, you need to know the data very well. Bad data is disastrous for AI. With a BI dashboard or report, you can still notice bad data yourself but not with a machine learning model.
- Determine a dataset for training: to develop a machine learning model, you should train the algorithm with a representative dataset. It should be free of biases. Don’t stare blindly at your own data. Nowadays you can also buy datasets for training algorithms.
- Have your model validated: together with domain experts and a machine learning engineer, you will validate the model. Observe what happens under the hood (as far as you can still understand it) and what outcomes the model generates given the input.
- Fine-tune the model: based on the results from the previous step, you are going to fine-tune the model and shorten it if necessary. Make sure that the model performs just right for its purpose. Sometimes 25% accuracy is enough; the model performs better than a human can do. But for medical assessments, you need much higher accuracy.
- Set up a production environment for AI: as with dashboards and reports, for machine learning, you need a production environment on which to run the machine learning models.
- Take the model into production: now the machine learning model is ready to actually start making an assessment or prediction based on new input. You have reached a fantastic milestone because few AI applications make it to the finish line.
- Evaluate performance: be sure to monitor the model’s performance first daily and later weekly. Stay with it the first time and see what happens. Provide a backup system.
- Communicate success: is the performance of the model good enough? Then communicate the success to the organization.
- Organize an AI party: successes should be celebrated together, and this success certainly deserves a party. Invite everyone involved in the success and thank everyone for their efforts and results.
- Determine lessons learned: together with the team, determine what lessons can be learned from the first AI implementation. Summarize them on an A4 sheet.
- Link the AI findings back to the client: together with the Product Owner, talk to the client and link back the AI findings so far.
- Repeat step 81: now start automating other decisions with machine learning. Sharpen your vision for AI.
- Define the new organization: all key decisions are now supported with Business Intelligence dashboards, reports, or machine learning. Do you need more or fewer employees now? Where can you downsize and where do you need to axe? Together with the board and management, define what the organization will look like in the future. Make a social plan.
- Sign up for the Dutch BI & Data Science Award: every other year we organize this award for the Smartest Organization in the Netherlands where data-driven working is the norm.
Maybe you have already noticed. During these 101 steps, you actually went through 3 phases. First you focus on Business Intelligence dashboards, data-driven work, and decisions. Next comes a phase of restructuring, and building a solid data architecture and migration. In the final phase, you implement machine learning.
Delve deeper into BI & analytics here
On the surface, Business Intelligence seems simple but the devil is in the details. So delve further into the field here:
If you don’t understand BI well (enough), the chances of achieving success with it are very limited.
What are the roles required for BI?
To properly implement Business Intelligence, you need several roles to do the work:
- Data analyst: primarily analyzes data, sometimes builds KPI dashboards [profile].
- BI or data architect: devises and models the overall BI architecture [profile].
- Data engineer: models the data so that it is suitable for data analysis.
- Dashboard developer: primarily designs and builds the dashboards.
- Report builder: develops reports and sometimes charts.
- BI manager: the person ultimately responsible for Business Intelligence [profile].
- Data scientist: primarily creates machine learning models (supervised, unsupervised) [profile].
- Data coach: primarily helps decision-makers make data-driven decisions.
- Data steward: responsible for data quality and definitions.
There are more Business Intelligence roles, but these are the most important ones. Some roles can be performed by the same person.
How much does Business Intelligence cost?
The investment you need to make in Business Intelligence is limited in the first phase. Later, the amounts can increase significantly, but certainly so can the return on investment (ROI). The cost of a BI implementation assumes the following categories:
- Software licensing costs: this refers to the cost of storing the data in a database and developing and viewing interactive dashboards with possibly detailed reports. You can assume an average of 10 to 50 euros per user per month depending on the supplier. For the database, in the cloud, you only pay for usage. This is often pennies per MB of storage and/or transfer.
- Development costs: for the development of interactive dashboards, you should on average consider 2,500 euros per KPI and 1,000 euros per dashboard page. A complete BI dashboard quickly amounts to 15,000 euros. For the construction of a data warehouse/database, you must consider a minimum of 5,000 euros per KPI, 7,500 euros per dimension, and an initial investment of 10,000 euros.
- Management costs: the management of Business Intelligence can usually be done internally by the client (after training). On average, after an initial implementation, you need a data engineer for 0.2 FTE and for the dashboards about 0.5 FTE. When multiple dashboards and reports are delivered, management costs naturally increase.
In larger organizations, a so-called OTAP street is common. These costs are not included in the above amounts. Request a quote here.
Business Intelligence examples from 4 sectors
Do you want to be inspired by successful Business Intelligence examples? Then consult one or more of the four examples below. We work for a large number of housing corporations, hospitals, mental health institutions, security regions, municipalities, provinces, ministries, banks, transport companies, and wholesalers.
Take the test: contact us
Have we been able to inform you well about all aspects of Business Intelligence that are important to you? Would you like to discuss this further with one of our BI experts? Don’t hesitate, contact us here.